Overcoming 2025's Biggest Hurdles in Automated DBTL Cycles for Accelerated Drug Discovery
This article provides a comprehensive guide for researchers and drug development professionals tackling the core challenges in automating the Design-Build-Test-Learn (DBTL) cycle.
Overcoming 2025's Biggest Hurdles in Automated DBTL Cycles for Accelerated Drug Discovery
Abstract
This article provides a comprehensive guide for researchers and drug development professionals tackling the core challenges in automating the Design-Build-Test-Learn (DBTL) cycle. It explores the foundational barriers of legacy systems and data silos, details emerging methodologies like AI-driven data automation and agentic AI, offers strategies for optimizing collaboration and ROI, and establishes a framework for robust clinical validation and regulatory compliance. The goal is to equip scientific teams with the knowledge to create faster, more reliable, and scalable automated discovery pipelines.
Navigating the Foundational Hurdles: Legacy Systems, Data Silos, and Workforce Resistance
The Legacy System Integration Problem in Biomedical Research
Technical Support Center
Troubleshooting Guides
Issue 1: System Integration Failures in Automated DBTL Cycles
Problem: Legacy systems fail to communicate with modern biofoundry equipment during Design-Build-Test-Learn (DBTL) automation, causing pipeline interruptions.
Symptoms:
- Inability to transfer DNA sequence designs from legacy systems to automated DNA assembly platforms
- Data format mismatches between older Laboratory Information Management Systems (LIMS) and modern analytical tools
- Failure to execute automated protocols due to communication timeouts
Resolution Steps:
- Implement API Bridges: Deploy healthcare APIs as middleware to enable communication between legacy systems and modern biofoundry equipment. These act as "code-based messengers" to facilitate safe, secure data transfer between applications [1].
- Data Standardization: Convert all data inputs and outputs to CDISC standards (SDTM, ADaM, ODM) before processing through the DBTL cycle to ensure interoperability [2].
- Protocol Validation: Test integration points with pilot projects before full implementation. Start with non-critical workflows to identify compatibility issues [3].
Prevention:
- Conduct regular system audits to identify integration vulnerabilities
- Implement real-time data monitoring tools to detect communication failures early
- Establish data governance frameworks to maintain format consistency [2]
Issue 2: Data Quality Degradation in Research Data Management
Problem: Manual data entry and legacy system limitations introduce errors that compromise research data integrity.
Symptoms:
- Inconsistent data formatting across different research sites
- Missing critical data points in experimental results
- Typographical errors in dosage recordings and measurement units
Resolution Steps:
- Electronic Data Capture (EDC) Implementation: Deploy EDC systems with built-in validation checks to reduce manual entry errors, improving data accuracy by over 30% [2].
- Standardized Procedures: Create uniform SOPs and data dictionaries ensuring all research sites follow identical data entry protocols [2].
- Automated Validation: Implement real-time data monitoring tools that immediately flag inconsistencies for correction [2].
Prevention:
- Regular training programs for staff to ensure proper protocol understanding
- Establish data quality metrics and monitoring dashboards
- Implement automated data cleaning scripts for common error patterns
Issue 3: Legacy System Security Vulnerabilities
Problem: Outdated operating systems and software in research environments create cybersecurity risks that can compromise sensitive research data.
Symptoms:
- System vulnerabilities to ransomware and cyberattacks
- Inability to implement modern encryption standards
- Compliance violations with data protection regulations
Resolution Steps:
- Security Assessment: Conduct regular security audits to identify vulnerabilities in legacy systems [4].
- Access Controls: Implement stringent access limitations to ensure only authorized personnel can access critical systems [4].
- Encryption Implementation: Apply advanced encryption to sensitive research data both at rest and in transit [5].
- System Patching: Keep all system software updated with the latest security patches, despite compatibility challenges [4].
Prevention:
- Develop comprehensive incident response plans
- Provide ongoing security awareness training
- Consider phased modernization of most vulnerable systems [4]
Frequently Asked Questions (FAQs)
Q: Why are legacy systems still prevalent in biomedical research environments? A: According to a HIMSS survey, 73% of healthcare providers still use legacy operating systems, primarily due to cost constraints, complexity of migrating research data, and resistance to change from staff accustomed to existing workflows. The financial investment required for system replacement can be prohibitive for research institutions with limited budgets [5].
Q: What are the specific impacts of legacy systems on automated DBTL cycle iteration? A: Legacy systems disrupt DBTL cycles by creating data silos that prevent seamless information flow between design, building, testing, and learning phases. They cause slower processes through excessive manual data entry, increase error rates due to documentation inefficiencies, and create poor interoperability that prevents effective data sharing between departments or research facilities. This significantly slows iteration speed in synthetic biology research [5] [6].
Q: How can we integrate AI and machine learning capabilities with our existing legacy research systems? A: Successful AI integration requires a strategic approach: (1) Begin with assessment and planning to evaluate existing systems and identify capability gaps; (2) Partner with AI technology providers who specialize in your research domain; (3) Start with pilot projects to test integration in a controlled environment before full-scale implementation. Companies like Pfizer and Roche have successfully leveraged this approach to enhance manufacturing and quality control processes [3].
Q: What are the compliance risks associated with maintaining legacy systems in regulated research environments? A: Legacy systems struggle to keep pace with evolving standards like HIPAA, GDPR, and FDA requirements, potentially resulting in substantial fines and penalties. According to BDO's 2024 Healthcare CFO Outlook Survey, 51% of healthcare CFOs say data breaches are becoming one of the biggest risks compared to previous years, highlighting increasing regulatory concerns [4].
Q: What quantitative improvements can we expect from modernizing our legacy research systems? A: Successful modernization projects have demonstrated significant gains: up to 50% improvement in operational agility, 30% performance enhancement, over 40% increase in bug resolution efficiency, and elimination of security incidents post-update. These metrics translate to faster research cycles and more reliable experimental results [7].
Quantitative Data Analysis
Legacy System Prevalence in Biomedical Research
Table 1: Legacy Operating System Usage in Healthcare and Research Environments
| Operating System | Usage Percentage | Primary Research Impact |
|---|---|---|
| Windows Server 2008 | 35% | Security vulnerabilities, integration limitations |
| Windows 7 | 34% | Compliance risks, unsupported features |
| Legacy Medical Device OS | 25% | Data siloing, interoperability issues |
| Windows XP | 20% | Critical security risks, inability to modernize |
| Windows Server 2003 | 19% | Performance bottlenecks, maintenance costs |
Source: HIMSS Survey Data [5]
Data Management Challenges in Research Settings
Table 2: Data Management Challenges and Prevalence in Biomedical Research
| Challenge Category | Prevalence | Impact on Research Quality |
|---|---|---|
| Data handling problems | 84% of researchers | Delayed research timelines, inaccurate results |
| Manual data entry errors | Up to 40% reduction with EDC | Compromised data integrity, statistical bias |
| Lack of Laboratory Information Management Systems | 86% of labs | Inefficient data tracking, provenance issues |
| Protocol complexity issues | >50% of data issues | Reduced reproducibility, implementation variability |
Source: Academic Biomedical Research Needs Assessment [8]
Experimental Protocols for System Integration
Protocol 1: API Integration Methodology for Legacy Systems
Purpose: To establish secure communication between legacy research systems and modern biofoundry equipment.
Materials:
- Legacy system with database access
- API middleware solution
- Modern biofoundry equipment (liquid handlers, sequencers)
- Authentication and encryption tools
Procedure:
- Collaborative Discovery Phase: Conduct comprehensive analysis of existing legacy system architecture and data flows [1].
- Secure API Design: Develop APIs following healthcare security best practices, including HIPAA-compliant data transmission protocols [1].
- Testing & Iterative Deployment: Implement pilot project to validate integration, starting with non-critical data transfers [1].
- Ongoing Management: Establish monitoring and support protocols for continuous integration performance [1].
Validation: Successful data transfer measured by complete record migration with zero data loss and transaction speeds meeting biofoundry throughput requirements.
Protocol 2: Legacy System Modernization for Research Environments
Purpose: To update aging research systems while preserving critical historical data and maintaining research continuity.
Materials:
- Legacy system inventory
- Modern technology stack (Angular 2+, Node.js)
- Data migration tools
- Testing frameworks
Procedure:
- Problem Mapping: Identify specific instability issues, functionality gaps, and security vulnerabilities [7].
- Technology Migration: Transition from obsolete frameworks (AngularJS) to modern equivalents (Angular 2+) [7].
- Functionality Enhancement: Incorporate new features addressing contemporary research challenges while maintaining existing workflows [7].
- Comprehensive Testing: Conduct unit tests, end-to-end validation, and user acceptance testing before full deployment [7].
Validation: System performance metrics showing at least 30% improvement in processing speed and 40% reduction in critical errors.
Workflow Visualization
Current Problem State: Legacy System Disruption in DBTL Cycles
Solution State: Integrated Research Environment
The Scientist's Toolkit: Research Reagent Solutions
Table 3: Essential Research Materials and Functions for Legacy System Integration
| Tool/Technology | Function | Application Context |
|---|---|---|
| Healthcare APIs | Enable communication between disparate systems | Legacy-to-modern system integration [1] |
| Electronic Data Capture (EDC) Systems | Digitize data collection with validation checks | Research data management modernization [2] |
| Angular 2+ Framework | Modern web application development | Legacy user interface modernization [7] |
| Node.js | Server-side JavaScript runtime | Backend system enhancement [7] |
| CDISC Standards (SDTM, ADaM) | Standardized data models for clinical research | Data format interoperability [2] |
| Cloud Data Repository | Scalable, secure data storage | Centralized research data management [2] |
| Machine Learning Algorithms | Predictive analysis and pattern recognition | Enhanced Learning phase in DBTL cycles [9] |
| Cell-Free Expression Systems | Rapid protein synthesis without cloning | Accelerated Build-Test phases [9] |
Confronting Data Fragmentation and Siloed Workflows
Troubleshooting Guide
This guide addresses common technical issues that disrupt the automated Design-Build-Test-Learn (DBTL) cycle, helping researchers maintain efficient and iterative bioengineering workflows.
Q: Our automated DBTL pipeline is failing due to inconsistent data formats between the "Build" and "Test" phases. How can we resolve this?
- A: Data format mismatches often arise from siloed instrumentation software. Implement a unified data schema and use integration platforms to create seamless data flow.
- Protocol: Establish a standardized data schema (e.g., using JSON or XML) for all experimental data. Utilize integration platforms or custom scripts to create real-time data pipelines that automatically convert instrument outputs into this common schema before they enter the central database. This ensures that the "Test" phase can reliably consume data from the "Build" phase.
Q: Our machine learning models for the "Learn" phase are underperforming due to poor-quality, fragmented training data. What can we do?
- A: This indicates a need for robust data governance and consolidation. Incomplete or siloed data severely limits the predictive power of ML models [10].
- Protocol: Create a centralized data repository, such as a data lake, to aggregate structured and unstructured data from all DBTL cycles [11]. Enforce data governance policies that define roles, responsibilities, and quality checks (e.g., required metadata fields, allowable value ranges) for all data entries. This provides the clean, comprehensive datasets needed for effective model training.
Q: How can we prevent workflow silos when different teams use specialized tools for "Design" (CAD software) and "Build" (automation scripts)?
- A: Strategic integration is key to breaking down barriers between departments and disconnected software systems [12].
- Protocol: Adopt tools with native integration capabilities or use APIs to connect them. For example, tools like AssemblyTron integrate DNA assembly design outputs directly with liquid handling robots for automated execution [6]. Foster a culture of cross-functional collaboration by aligning team goals and KPIs to encourage data and resource sharing.
Q: Our automated workflows are brittle and break whenever a software tool updates its API. How can we create more resilient systems?
- A: This fragility stems from over-reliance on point-to-point integrations. Moving to a more modular architecture can mitigate this risk.
- Protocol: Instead of hardcoding connections, use a middleware layer or an orchestration framework (e.g., Apache Airflow, Nextflow) to manage tasks. Containerize software components (e.g., using Docker) to ensure consistent execution environments. This abstraction makes the workflow more robust to changes in individual tools.
Frequently Asked Questions (FAQs)
Q: What are the most critical initial steps to reduce data fragmentation in a new biofoundry?
Q: We are considering a "Learn-Design-Build-Test" (LDBT) approach. What is its main advantage?
- A: The LDBT cycle begins with a machine learning-driven Learn phase that analyzes existing data to predict optimal designs before moving to the lab [13]. This "learn-first" ethos can dramatically accelerate development by reducing costly trial-and-error in the Build-Test phases, converging on high-performance constructs with fewer iterations [13].
Q: How can we evaluate if a new software tool will exacerbate our siloed workflows?
- A: During vendor evaluation, ask:
- Does it offer native integrations with our core systems (e.g., LIMS, data warehouses)?
- Does it support open standards and APIs for easy data exchange?
- Is it designed to scale with our organization and regularly update its integration capabilities? [12] A "no" to these questions suggests the tool may create a new silo.
- A: During vendor evaluation, ask:
Q: What are the quantifiable business impacts of data silos we can use to justify consolidation projects?
- A: Data silos have measurable negative impacts, including poor data quality that can cost organizations an average of $12.9 million annually [12]. Furthermore, data fragmentation can cost industries like healthcare tens to hundreds of billions of dollars per year through inefficiencies and errors [11].
Experimental Protocols for Key Cited Studies
1. Protocol for a Machine Learning-Driven LDBT Cycle [13]
- Objective: To accelerate genetic construct optimization by reordering the cycle to begin with a machine learning-based "Learn" phase.
- Methodology:
- Learn: Train machine learning models (e.g., neural networks) on historical DBTL data. Features include promoter sequences, RBS strengths, and codon usage. The model predicts expression levels for new designs.
- Design: Use the model's predictions to in silico generate a focused set of high-potential genetic construct sequences.
- Build: Synthesize the top-predicted sequences using high-throughput methods, such as automated DNA assembly.
- Test: Rapidly characterize the constructs using a cell-free transcription-translation (TX-TL) system, obtaining protein expression data in hours.
- Iterate: Feed the new experimental data back into the ML model to refine its predictions and initiate the next LDBT cycle.
2. Protocol for a High-Throughput DBTL Pressure Test [6]
- Objective: To rapidly research, design, and develop microbial strains for the production of 10 target molecules within 90 days.
- Methodology:
- Design: Utilize a suite of bioinformatics tools (e.g., RetroPath 2.0 for retrosynthesis) to design pathways for diverse molecules, from simple chemicals to complex natural products with unknown pathways.
- Build: Employ automated strain construction across multiple host species (e.g., E. coli, S. cerevisiae). The referenced team built 215 strains and synthesized 1.2 Mb of DNA.
- Test: Develop and run high-throughput, molecule-specific assays (e.g., in-house developed assays for the target molecules) to screen for production. The team performed 690 assays.
- Learn: Analyze production data to identify successful strains and pathways, iterating on designs for molecules not initially successful.
Workflow Visualization
The following diagrams illustrate the core workflows discussed in this guide.
Traditional DBTL Cycle Workflow
Machine Learning-Driven LDBT Cycle
The Scientist's Toolkit: Key Research Reagent Solutions
The following table details essential materials and tools for implementing advanced, automated DBTL cycles.
| Item | Function in DBTL Cycle |
|---|---|
| Cell-Free Transcription-Translation (TX-TL) Systems | Enables rapid, high-throughput testing of genetic circuits without the complexities of living cells, drastically speeding up the "Test" phase [13]. |
| j5 DNA Assembly Design Software | An open-source tool for automating the design of DNA assembly strategies, standardizing and accelerating the "Design" phase [6]. |
| AssemblyTron | An open-source Python package that integrates j5 design outputs with Opentrons liquid handling robots, bridging the "Design" and automated "Build" phases [6]. |
| SynBiopython | An open-source software library developed by the Global Biofoundry Alliance to standardize DNA design and assembly efforts across different platforms and labs [6]. |
| Cameo & RetroPath 2.0 | Computational tools used for in silico design of metabolic engineering strategies and retrosynthesis, supporting the data-driven "Learn" and "Design" phases [6]. |
Workforce Resistance and the Skills Gap in Automated Environments
Troubleshooting Guide: Common Issues in Automated DBTL Environments
FAQ 1: Our team is experiencing a high rate of failed strain constructions in the automated "Build" phase. How can we troubleshoot this?
Answer: A high failure rate in automated strain construction often indicates a process optimization issue rather than a fundamental scientific problem. Follow this systematic approach:
- Confirm Process Calibration: First, verify that all liquid handling robots and synthesis instruments are correctly calibrated. Run standard control sequences to confirm pipetting accuracy and volume delivery.
- Review DNA Library Quality: Check the quality and concentration of your input DNA parts library. Degraded or impure DNA is a common cause of assembly failure in high-throughput workflows [14]. Implement stringent quality control checks before assembly.
- Simplify and Test a Subset: Reduce complexity by testing a smaller subset of constructs with known performance. If these fail, the issue is likely with your current assembly reaction conditions or instrumentation.
- Investigate Cross-Contamination: In highly automated, parallel workflows, cross-contamination between samples can occur. Use negative controls to identify if contamination is skewing your results.
FAQ 2: Our researchers are resistant to adopting new AI and machine learning tools for the "Learn" phase. How can we address this?
Answer: Resistance to AI/ML tools often stems from a skills gap and lack of trust in algorithmic outputs. Address this with a phased approach:
- Start with Assisted, Not Autonomous, Tools: Begin by implementing AI tools that assist with data analysis and hypothesis generation rather than replacing human decision-making. This allows researchers to build confidence gradually [15].
- Provide Context-Specific Training: Offer hands-on workshops and seminars focused on applying AI/ML to specific biological problems, such as predicting metabolic flux or optimizing pathway designs, rather than abstract programming concepts [16].
- Demonstrate Quick Wins: Use a pilot project to demonstrate how ML can successfully recommend new strain designs for the next DBTL cycle, leading to a measurable improvement in product titer or yield [15].
- Establish Cross-Functional Partnerships: Pair biologists with data scientists. This fosters mutual understanding—biologists gain AI literacy, while data scientists deepen their domain knowledge, leading to more effective tool development [17].
FAQ 3: The data generated from our automated "Test" phase is inconsistent and difficult to interpret. What should we check?
Answer: Inconsistent high-throughput screening data can derail the entire DBTL cycle. Focus on these areas:
- Standardize Cultivation Conditions: In microbial strain engineering, even minor fluctuations in microtiter plate cultivation conditions (temperature, humidity, oxygen transfer) can cause significant variance. Ensure your automated incubators and bioreactors are properly maintained and monitored [15].
- Validate Analytical Assays: Re-calibrate all in-line sensors and analytical instruments (e.g., plate readers, HPLC). Use a standardized control strain in every experimental run to normalize and validate the data.
- Review Data Pipeline Integrity: Automating the data flow from instruments to analysis platforms is critical. Check for errors in data formatting, transfer, or parsing that could introduce noise or corrupt the dataset.
- Correlate with Low-Throughput Validation: Periodically validate your high-throughput results with low-throughput, gold-standard methods (e.g., flask studies followed by GC-MS) to ensure your automated platform is generating physiologically relevant data.
FAQ 4: We are struggling to find and retain staff with the right mix of biology and engineering skills. What long-term strategies can we employ?
Answer: Bridging the interdisciplinary talent gap requires a strategic combination of hiring, development, and new organizational models.
- Prioritize Upskilling Existing Staff: Invest in reskilling your current biology workforce. Hands-on training in data science, automation programming, and the use of AI-powered tools is essential to close the internal skills gap [16] [17].
- Adopt a Hybrid Hiring Model: Recognize that finding "unicorn" candidates with deep expertise in both biology and engineering is difficult. Instead, build interdisciplinary teams composed of biologists who are tech-literate and engineers who understand biological principles [16].
- Leverage Strategic Outsourcing: For highly specialized tasks, consider a hybrid outsourcing model. Partner with functional service providers (FSPs) or CROs to access specific AI and data science expertise without the long lead time and cost of a full-time hire [16] [17].
- Create Clear Career Paths: Define and communicate career trajectories for hybrid roles. 29% of frontline workers state that clearly defined career paths are crucial for them to thrive and remain in their roles [16].
Skills Gap and Workforce Data Analysis
The following table summarizes key quantitative findings on the current skills gap and workforce challenges in automated life sciences environments.
| Metric | Finding/Situation | Implication for DBTL Cycles |
|---|---|---|
| AI Skills Priority [17] | AI expertise is a top-3 hiring priority for 85% of large pharma leaders. | DBTL "Learn" phases are increasingly dependent on AI, creating a competitive talent market. |
| Workforce Preparedness [16] | 51% of biopharmaceutical leaders identify a critical need to hire AI experts in the next 3-5 years. | A significant shortage of in-house skills is hindering the optimization of iterative DBTL cycles. |
| New Roles Emergence [17] | 57.8% of required roles in life sciences are new, driven by AI and automation. | Traditional biologist roles are insufficient; teams need data scientists and automation specialists. |
| Hiring Timelines [17] | Filling an AI/ML Specialist role takes 4-6 months on average. | Project delays are likely if the talent strategy relies solely on external hiring. |
| Training Preference [16] | Most industry leaders believe in-person, hands-on training is more effective than online courses for upskilling. | Effective reskilling for automated DBTL requires practical, experiential learning. |
Experimental Protocol: Benchmarking a Machine Learning-Powered DBTL Cycle
This protocol provides a methodology for evaluating a new machine learning tool's performance in guiding iterative strain engineering, a common challenge where skills gaps often emerge.
Objective: To systematically compare the effectiveness of a new ML-based recommendation engine against a traditional, researcher-driven approach for combinatorial pathway optimization over three DBTL cycles.
Materials:
- Strain Library: A defined library of DNA parts (promoters, RBSs, CDSs) for a pathway of interest.
- Automated Strain Construction System: e.g., a benchtop DNA printer or automated molecular biology platform [18].
- High-Throughput Screening System: Microtiter plates, automated incubators, and plate readers for measuring strain performance (e.g., product titer).
- ML Recommendation Software: The ML tool to be evaluated (e.g., based on gradient boosting or random forest models as used in simulated studies [15]).
Procedure:
- Initial Design (Cycle 0): Create an initial training set by constructing and screening a diverse set of 50 strains from the library. Measure the product titer for each strain.
- Cycle 1 - Control Arm: Provide the dataset to an experienced research team. Ask them to use their expertise to select the next 50 strains to build and test.
- Cycle 1 - Experimental Arm: Provide the same dataset to the ML recommendation engine. Use its top 50 predictions to select strains for construction and testing.
- Subsequent Cycles (2 & 3): Repeat the "Build" and "Test" phases for both arms. For each new cycle, provide all accumulated data to both the research team and the ML tool to inform their next set of design choices.
- Analysis: After three complete cycles, compare the performance of the best-producing strain from each arm and the overall performance trajectory (e.g., the average titer per cycle). Evaluate the resource efficiency of each approach.
The Scientist's Toolkit: Key Reagents & Materials for Automated DBTL
| Item | Function in Automated DBTL |
|---|---|
| Benchtop DNA Printer/Synthesizer | Enables in-lab, on-demand production of DNA constructs, accelerating the "Build" phase and maintaining confidentiality of proprietary sequences [18]. |
| Standardized DNA Part Library | A collection of characterized biological components (promoters, genes, terminators) that are functionally modular and can be reliably assembled in different combinations [14]. |
| Automated Liquid Handling Robot | Performs repetitive pipetting tasks (e.g., PCR setup, transformation) with high precision and speed, enabling high-throughput "Build" and "Test" phases [14]. |
| Machine Learning Recommendation Tool | Software that analyzes experimental data from the "Test" phase to predict and recommend the most promising strain designs for the next "Design" cycle, optimizing the "Learn" phase [15]. |
| Microtiter Plate Bioreactors | Small-scale cultivation vessels that allow for parallel fermentation of hundreds of microbial strains under controlled conditions, facilitating high-throughput phenotyping during the "Test" phase [15]. |
Workflow Diagram: Integrating Human Expertise & Automation
The diagram below visualizes the optimized DBTL cycle, highlighting points of human-machine collaboration to overcome workforce resistance and skills gaps.
Identifying and Prioritizing DBTL Processes for Automation
Core DBTL Concept and Automation Challenges
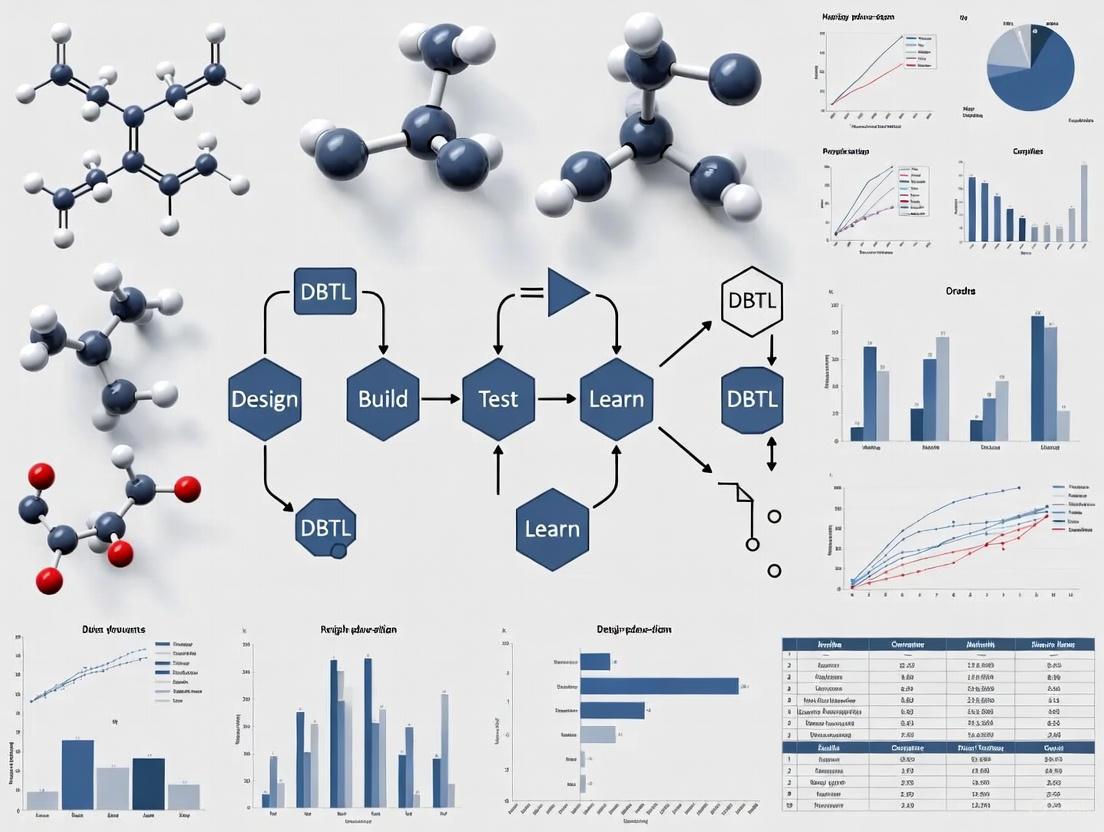
The Design-Build-Test-Learn (DBTL) cycle is an iterative framework central to modern scientific fields like synthetic biology and metabolic engineering [19]. It involves four key phases: Design (planning genetic constructs or pathways), Build (physical assembly), Test (experimental validation), and Learn (data analysis to inform the next cycle) [20] [21].
Automating this cycle is crucial for overcoming the "involution" state, where numerous iterative cycles generate vast amounts of information without leading to performance breakthroughs [22]. However, researchers face significant challenges during automation, including data integration from disparate sources, selecting appropriate machine learning models, and managing the high computational and equipment costs associated with high-throughput platforms [22] [19] [21].
Troubleshooting Common DBTL Automation Issues
Design Phase Roadblocks
Problem: How can I efficiently explore a vast combinatorial design space without exhaustive testing? The number of possible genetic designs (e.g., promoter-gene combinations) can be enormous. Manually selecting designs to build and test is inefficient.
Solution: Employ statistical design of experiments (DoE) to create a reduced, representative library of constructs [21]. For instance, in a pinocembrin production pathway, a combinatorial design of 2592 possible configurations was reduced to 16 representative constructs using DoE, achieving a 500-fold improvement in production titer after two DBTL cycles [21].
Problem: My predictive models for biological systems are inaccurate. Traditional mechanistic models often struggle with the complexity and non-linearity of biological systems.
Solution: Integrate Machine Learning (ML) with mechanistic models. ML can capture complex, non-linear relationships from experimental data that are difficult to model explicitly [22] [19]. Use tools like RetroPath for automated pathway selection and Selenzyme for enzyme selection to enhance the design phase [21].
Build & Test Phase Hurdles
Problem: Manual genetic assembly is slow, error-prone, and doesn't scale. Traditional cloning methods are a major bottleneck for high-throughput DBTL cycles.
Solution: Automate DNA assembly using liquid-handling robots and standardized protocols. The Opentrons OT-2 robot is a cost-effective platform for automated synthesis of genetic constructs [20]. Utilize standardized assembly methods like the Ligase Cycling Reaction (LCR), for which automated worklists can be generated [21].
Problem: Low-throughput testing creates a data bottleneck. Testing a few constructs at a time severely limits the learning rate of each DBTL cycle.
Solution: Implement high-throughput testing platforms. For colorimetric gas sensors, a platform capable of testing 384 sensing units simultaneously was developed [20]. For metabolic engineering, use 96-deepwell plates and automated, quantitative screening methods like fast UPLC-MS/MS for analyzing target products and key intermediates [21].
Learn Phase Obstacles
Problem: I cannot identify the key factors affecting system performance from my data. With multiple variables (e.g., promoter strength, gene order), it's difficult to determine which factors are most influential.
Solution: Apply statistical analysis and machine learning to test results. In the pinocembrin case, statistical analysis of the first DBTL cycle identified that vector copy number and the promoter strength of the CHI gene had the strongest significant effects on production, directly guiding the redesign for the second cycle [21].
Problem: Data from different cycles and experiments is siloed and unusable. Without a structured database, historical data cannot be leveraged for future ML.
Solution: Build a centralized, structured database for all DBTL data. Use repositories like JBEI-ICE to track all DNA parts and plasmid assemblies with unique IDs [21]. Develop a structured biomanufacturing database from scientific literature to facilitate knowledge mining and feature engineering for ML [22].
Frequently Asked Questions (FAQs)
Q1: What is the single most important factor for a successful automated DBTL pipeline? A seamless data flow is critical. The pipeline must be designed so that data and learnings from one phase automatically inform the next. This requires integrated software tools, automated data tracking, and a centralized data repository [19] [21].
Q2: My automated platform is producing more data than we can analyze. What should we do? Focus on automating the "Learn" phase. Implement custom data processing scripts (e.g., in R or Python) for automated data extraction and analysis. Use ML not just for design but also to automatically identify patterns and relationships in the test data [21].
Q3: How do we prioritize which process in our lab to automate first? Adopt a value-driven or bottleneck prioritization method [23].
- Value-Driven: Automate the process that, if improved, would deliver the highest financial or scientific return (e.g., the rate-limiting step in your research).
- Bottleneck: Target the process that is clearly impeding overall workflow efficiency, such as a manual cloning step that slows down all projects. Use process flow models to identify where the biggest delays occur [23].
Q4: Are there cost-effective options for automating the "Build" phase? Yes. The "Opentrons OT-2" is a cited example of a relatively low-cost, open-source liquid-handling robot that can be used for automated synthesis of materials like colorimetric sensor formulations, making automation more accessible [20].
Q5: How can we manage the intellectual property (IP) of AI-generated designs or data from automated systems? This is a recognized challenge. It's crucial to establish robust data-sharing mechanisms and comprehensive IP protections for algorithms and generated designs early in the process. The field is still adapting to these new challenges [24].
Experimental Protocol: An Automated DBTL Pipeline for Metabolic Engineering
This protocol is adapted from an automated DBTL pipeline for optimizing microbial production of fine chemicals [21].
Objective
To iteratively optimize a biosynthetic pathway in E. coli for enhanced production of a target compound (e.g., the flavonoid pinocembrin) using a fully integrated and automated DBTL cycle.
Methodology
Design Stage:
- Pathway & Enzyme Selection: Use computational tools
RetroPath[24] andSelenzymeto select candidate enzymes for the target pathway. - Combinatorial Library Design: Design a library of genetic constructs varying key parameters such as:
- Vector backbone (copy number: High/ColE1, Medium/p15a, Low/pSC101).
- Promoter strength (Strong/Ptrc, Weak/PlacUV5, None) for each gene.
- Gene order (permutations of the pathway genes).
- Library Reduction: Apply Design of Experiments (DoE) based on orthogonal arrays to reduce the combinatorial library to a tractable number of representative constructs (e.g., from 2592 to 16).
Build Stage:
- DNA Synthesis: Source genes via commercial DNA synthesis.
- Automated Assembly:
- Use
PartsGeniesoftware to design reusable DNA parts with optimized ribosome-binding sites. - Generate robotic worklists for the Ligase Cycling Reaction (LCR) assembly.
- Execute the assembly on a liquid-handling robotics platform (e.g., Opentrons OT-2).
- Use
- Quality Control (QC): Perform automated plasmid purification, restriction digest analysis via capillary electrophoresis, and sequence verification.
Test Stage:
- Culture & Induction: Transform constructs into the production chassis (E. coli). Use a robotic platform to inoculate cultures in 96-deepwell plates and execute growth/induction protocols.
- Product Analysis:
- Perform automated metabolite extraction.
- Quantify target product and key intermediates using fast UPLC-MS/MS.
Learn Stage:
- Data Processing: Use custom R scripts for automated data extraction and processing.
- Statistical Analysis & Machine Learning: Apply statistical methods (e.g., Analysis of Variance) to identify the main design factors (e.g., promoter strength, gene order) that significantly influence production titers.
- Redesign: Use the statistical insights to define new, more constrained design rules for the next DBTL cycle.
Key Research Reagent Solutions
Table: Essential materials for automated metabolic engineering pipeline
| Item | Function in the Protocol | Example/Specification |
|---|---|---|
| Liquid Handling Robot | Automates liquid transfers for DNA assembly and culture setup. | Opentrons OT-2 [20] |
| DNA Assembly Method | High-efficiency, robot-friendly method for constructing plasmids. | Ligase Cycling Reaction (LCR) [21] |
| Production Chassis | The host organism for expressing the biosynthetic pathway. | Escherichia coli (e.g., strain DH5α) [21] |
| High-Throughput Screening Platform | Enables parallel testing of many constructs. | 96- or 384-deepwell plate systems [20] [21] |
| Analytical Instrumentation | Precisely quantifies target compounds and intermediates. | UPLC-MS/MS (Ultra-Performance Liquid Chromatography-Tandem Mass Spectrometry) [21] |
| Statistical Software | Analyzes experimental data to identify key performance factors. | R or Python with statistical/ML libraries [21] |
DBTL Workflow and Optimization Cycle Visualization
DBTL Cyclic Workflow: This diagram illustrates the core iterative process of the Design-Build-Test-Learn cycle, where insights from each iteration feed directly into the next design phase.
Manual vs Automated DBTL Impact: This diagram contrasts the traditional manual DBTL process, which risks stagnation ("involution"), with the automated, data-driven pipeline that enables rapid optimization and discovery.
Establishing Clear Automation Goals and Success Metrics
For researchers, scientists, and drug development professionals, the automated Design-Build-Test-Learn (DBTL) cycle represents a paradigm shift in metabolic engineering and synthetic biology. While automation accelerates the construction of microbial cell factories, its success hinges on establishing clear, quantifiable goals and metrics from the outset [25]. Without a rigorous framework for defining objectives and measuring outcomes, laboratories risk investing in expensive automation platforms that fail to deliver reproducible, high-quality results. This technical support guide provides a structured approach to goal-setting and performance measurement for automated DBTL iteration, enabling research teams to maximize their return on investment and advance next-generation drug development pipelines.
Key Performance Indicators for Automated DBTL Cycles
Effective monitoring of an automated DBTL platform requires tracking metrics across its entire workflow. The following table summarizes essential quantitative indicators for evaluating performance at each stage.
Table 1: Key Performance Indicators for Automated DBTL Cycle Monitoring
| DBTL Stage | Key Metric | Definition | Target Benchmark |
|---|---|---|---|
| Design | In silico Design Success Rate | Percentage of designed constructs flagged as viable by genome-scale metabolic models (GSMM) and AI-based tools [25]. | >95% |
| Build | Assembly Throughput | Number of genetic constructs successfully assembled per unit time (e.g., per week) by automated genome engineering systems (e.g., MAGE) [25]. | Varies by system; aim for consistent week-over-week increase. |
| Build | Cloning Efficiency | Percentage of assembled constructs that yield correct sequences upon verification (e.g., via sequencing) [25]. | >90% |
| Test | Analytical Throughput | Number of samples processed per day via automated analytical techniques (e.g., FIA, SWATH-MS) [25]. | Varies by assay; target maximum platform capacity. |
| Test | Data Quality Score | A composite score based on signal-to-noise ratio, replicate consistency, and adherence to quality control standards in omics data [25]. | >95% pass rate against predefined QC thresholds. |
| Learn | Model Prediction Accuracy | The accuracy of machine learning (ML) models (e.g., GNNs, PINNs) in predicting experimental outcomes, measured against holdout test data [25]. | >85% for iterative model improvement. |
| Overall Cycle | Cycle Time | Total time required to complete one full DBTL iteration, from initial design to data-driven hypothesis for the next cycle [25]. | Progressive reduction with each optimized iteration. |
Frequently Asked Questions (FAQs)
1. Our automated strain construction has high throughput, but our learning phase is the bottleneck. What metrics can help diagnose this?
The issue likely lies in data integration and model training. Focus on these metrics:
- Data Processing Lag Time: Measure the time between raw data generation from the "Test" phase and its availability in a structured format for ML models. The goal should be minimal lag [25].
- Model Training/Retraining Cycle Time: Track how often your ML models (e.g., SVMs, GANs) are updated with new experimental data. Long cycles prevent rapid learning [25].
- Hypothesis Generation Rate: Monitor the number of testable, data-driven hypotheses the "Learn" phase produces per week. A low rate indicates a weak learning feedback loop.
2. How can we set realistic but ambitious goals for improving our DBTL cycle time?
Use a phased approach:
- Phase 1 - Baseline Establishment: For the first 1-2 cycles, simply measure the current total cycle time and the time spent in each segment without making changes.
- Phase 2 - Target Setting: Analyze the baseline data to identify the slowest segment. Set a Specific, Measurable, Achievable, Relevant, and Time-bound (SMART) goal to reduce the time in that segment by a specific percentage (e.g., 15-20%) over the next two cycles [26].
- Phase 3 - Systematic Reduction: Once the largest bottleneck is improved, identify and target the next slowest segment. This iterative method ensures continuous, measurable progress toward a fully optimized cycle [25] [26].
3. What are the most critical success metrics for securing further funding for our automated biofoundry?
Beyond technical metrics, funders need evidence of efficiency and return on investment. Emphasize:
- Cost Per Construct: The fully burdened cost to design, build, and validate a single genetic construct. A downward trend demonstrates improving efficiency and cost-control.
- Experiment Success Rate: The percentage of initiated DBTL cycles that successfully generate actionable learning or a validated hypothesis. This shows overall platform reliability [25].
- Researcher Throughput: Measure the number of distinct research projects or hypotheses a single scientist can test per quarter using the automated platform. This highlights the multiplicative effect of the infrastructure [26].
Troubleshooting Guides
Issue: Stagnating Model Prediction Accuracy in the Learn Phase
Symptoms: Machine learning models used to design new constructs are no longer improving in accuracy, leading to diminishing returns from DBTL iterations.
Diagnosis and Resolution:
- Audit Data Quality and Quantity:
- Action: Check the
Data Quality Score(from Table 1) for recent cycles. Ensure data from the "Test" phase meets quality thresholds. - Solution: If data quality is high but volume is low, you may need to run more "Test" experiments to generate a larger, more diverse training dataset for the ML models [25].
- Action: Check the
- Check for Data Drift:
- Action: Compare the statistical distributions of input features (e.g., promoter strengths, metabolite levels) between the data used to train the model and newly generated data.
- Solution: If drift is detected, retrain your models (e.g., VAEs, GNNs) on a combined dataset that includes both historical and new data to keep the models current [25].
- Re-evaluate Model Features:
- Action: Perform feature importance analysis on your models. The relevant biological features may have changed as the research advances.
- Solution: Work with domain experts to incorporate new biological knowledge or omics measurements (e.g., from flux balance analysis) into the model's feature set [25].
Diagram 1: Troubleshooting stagnating model accuracy in the Learn phase.
Issue: Low Cloning Efficiency in the Automated Build Phase
Symptoms: A high percentage of assembled genetic constructs fail verification sequencing, leading to wasted reagents, time, and inadequate sample progression to the Test phase.
Diagnosis and Resolution:
- Verify Reagent Integrity:
- Action: Check the expiration dates and storage conditions of all enzymes (e.g., ligases, polymerases), buffers, and oligos used in the automated assembly process (e.g., LCR, USER) [25].
- Solution: Replace any reagents that are outdated or have not been stored correctly. Implement a first-in-first-out (FIFO) inventory system.
- Calibrate Liquid Handling Robots:
- Action: Run calibration and precision tests on the automated liquid handlers. Check for volume inaccuracies, especially with small volumes and viscous liquids.
- Solution: Recalibrate instruments according to manufacturer specifications. Consider using a dye-based assay to visually confirm dispensing accuracy across the entire platform.
- Validate Assembly Protocol Parameters:
- Action: Review the thermal cycler protocols (time, temperature) and reaction mixture compositions in the automated workflow. Compare them to manually verified protocols.
- Solution: Optimize protocol parameters specifically for the automated environment, which may differ from manual bench protocols. Introduce a positive control construct in every run to isolate protocol failures from random errors.
Diagram 2: Resolving low cloning efficiency in the automated Build phase.
The Scientist's Toolkit: Key Research Reagent Solutions
The following reagents and materials are fundamental for executing automated DBTL cycles. Their consistent quality is critical for reproducible results.
Table 2: Essential Reagents for Automated DBTL Workflows
| Reagent/Material | Function in DBTL Cycle | Critical Quality Metrics for Automation |
|---|---|---|
| High-Fidelity DNA Polymerases | "Build": Accurate amplification of genetic parts and assemblies [25]. | Low error rate, compatibility with automated liquid handling buffers, stability at 4°C. |
| Automation-Grade Restriction Enzymes & Ligases | "Build": Modular DNA assembly using standardized methods (e.g., Golden Gate) [25]. | Fast reaction kinetics, high specificity, uniform buffer system to enable complex mixtures. |
| Synthetic Oligonucleotides | "Build": Primers for assembly and sequencing; probes for screening [25]. | High purity (HPLC-grade), accurate concentration, low well-to-well variation in 96- or 384-well plates. |
| Liquid Handling Calibration Dyes | "Build"/"Test": Verification of dispensing accuracy across all nozzles of an automated liquid handler. | High contrast, chemical inertness, viscosity matching aqueous buffers. |
| Cell Lysis Reagents | "Test": Preparing samples for metabolomic or proteomic analysis [25]. | Rapid, consistent lysis; compatibility with downstream analytical techniques (e.g., Mass Spectrometry). |
| Internal Standards (Isotope-Labeled) | "Test": Quantifying metabolites in Mass Spectrometry (e.g., SRM/MRM, DIA) for precise Metabolic Flux Analysis (MFA) [25]. | Chemical purity, precise concentration, minimal isotopic impurity. |
| LC-MS Grade Solvents | "Test": Mobile phase for Liquid Chromatography coupled to Mass Spectrometry to minimize background noise [25]. | Ultra-high purity, low particulate content, consistent lot-to-lot composition. |
Implementing Next-Gen Solutions: AI, Data Automation, and Process Intelligence
Leveraging AI and Machine Learning for Smarter Data Ingestion and Analysis
Troubleshooting Guides and FAQs
This technical support center is designed for researchers and scientists working to optimize the Design-Build-Test-Learn (DBTL) cycle in bioprocess development, particularly in fields like metabolic engineering and drug development. The following guides address common challenges encountered when integrating AI and ML into these automated, data-intensive workflows.
Data Ingestion and Quality
Q: Our automated data ingestion pipelines are bringing in inconsistent or corrupt data, which is causing our downstream ML models to fail. What are the first things we should check?
Inconsistent data is a frequent culprit behind poor model performance. A structured approach to troubleshooting is key [27].
A1: Audit Your Data Sources and Preprocessing: Begin by verifying the integrity of your raw data. Check for common issues like missing values, inconsistent formatting due to mismanagement, or data corruption when combining streams from incompatible sources [27]. Implement a preprocessing checklist:
- Handle Missing Data: For features with a few missing values, impute using the mean, median, or mode. Remove data entries if multiple features are missing [27].
- Detect and Handle Outliers: Use box plots to identify values that stand out from the dataset, as these can skew model results [27].
- Normalize or Standardize Features: Ensure all features are on the same scale to prevent models from giving undue weight to those with larger magnitudes [27].
A2: Check for Data Imbalance: Imbalanced data, where one target class is over-represented, can lead to models with high accuracy but poor predictive power for the minority class. This is a critical edge-case consideration [27]. Techniques to address this include resampling the dataset (oversampling the minority class or undersampling the majority class) or data augmentation [27].
A3: Implement a Version Control System for Data: As your DBTL cycles iterate, your data will change. Using a data version control system (e.g., lakeFS) allows you to track changes to large datasets, revert to previous states, and maintain reproducibility across experiments [28].
Q: We are incorporating unstructured data (e.g., research notes, historical documents) into our analysis. How can we monitor its quality for AI use?
Unlike structured data, unstructured data operates in a traditional blind spot [29].
- A1: Implement Unstructured Data Monitoring: Adopt solutions that bring automated quality checks to text and image fields. This involves monitoring for issues like empty vector arrays, incomplete metadata, or corrupted text, which can severely degrade the context provided to AI models [29].
- A2: Monitor Embedding Quality: When using text data for AI, it is converted into numerical representations called embeddings. Monitor these embeddings for critical failures such as empty arrays, wrong dimensionality, or corrupted vector values. Poor embedding quality is often misdiagnosed as model "hallucination" [29].
Model Performance and Training
Q: Our ML model performed well on training data but generalizes poorly to new experimental data from the DBTL cycle. What could be the cause?
This is a classic problem often stemming from the model's relationship with the training data [27].
- A1: Diagnose Overfitting or Underfitting:
- Overfitting occurs when a model is too complex and learns the training data, including its noise, too closely. The result is a low-bias, high-variance model that fails on new data [27].
- Underfitting occurs when a model is too simple to capture the underlying trends, resulting in a high-bias, low-variance model that performs poorly even on training data [27].
- A2: Utilize Cross-Validation: Use k-fold cross-validation to evaluate your model's performance more reliably. This technique involves dividing the data into k subsets, training the model k times (each time using a different subset as the validation set and the rest as training data), and averaging the results. This helps ensure the final model can generalize to new data [27].
- A3: Perform Feature Selection: Not all input features contribute to a meaningful output. Input data can contain hundreds of features, many of which may be irrelevant. Selecting the most important features improves model performance and reduces training time. Techniques include [27]:
- Statistical Tests: Use univariate or bivariate selection (e.g., correlation, ANOVA) to find features with a strong relationship to the output variable.
- Principal Component Analysis (PCA): A dimensionality reduction algorithm that selects features with high variance, which typically contain more information.
- Feature Importance: Leverage algorithms like Random Forest to rank features based on their contribution to predictions.
Q: For our specific DBTL cycle, should we use a single powerful model or a system of smaller, specialized models?
The choice depends on the specific tasks and operational constraints. In 2025, the trend is shifting towards more efficient, specialized models [30].
- A1: Consider Small Language Models (SLMs) and Agentic Workflows: SLMs (1M-10B parameters) offer advantages in cost efficiency, edge deployment, data privacy, and easier customization for specific domains [30]. They are particularly well-suited for agentic AI systems, where multiple specialized SLMs can be orchestrated to tackle complex, multi-step processes within a DBTL cycle [29] [30].
- A2: Evaluate the Trade-offs: The following table compares the two approaches for DBTL applications:
| Characteristic | Large Foundation Models | Small Language Models (SLMs) & Agentic Workflows |
|---|---|---|
| Cost & Infrastructure | Higher computational cost and infrastructure demands [30]. | Lower operational costs, can run on local devices or edge infrastructure [30]. |
| Customization | Less flexible for domain-specific fine-tuning. | Easier to fine-tune and specialize for specific tasks (e.g., predicting enzyme kinetics) [30]. |
| Functionality | Single, powerful model for broad tasks. | System of multiple agents, each handling a discrete task (e.g., one for design recommendation, another for anomaly detection in tests) [29]. |
| Data Privacy | Often requires cloud processing. | Local processing eliminates data transmission, addressing privacy concerns [30]. |
AI and Workflow Integration
Q: The AI/ML recommendations from our DBTL cycle are inconsistent and difficult to trust for critical decisions like strain engineering. How can we improve reliability?
Trust is built on transparency, data quality, and a robust iterative process.
- A1: Adopt a Knowledge-Driven DBTL Cycle: Move beyond purely data-driven cycles. One effective method is to integrate upstream in vitro investigation (e.g., using cell-free protein synthesis systems) to test enzyme expression levels and pathway behavior before moving to costly in vivo experiments. This provides mechanistic insights and creates prior knowledge to guide the initial design phase, leading to more efficient cycling [31].
- A2: Ensure Proper "Context Engineering": The quality of the data provided to the model (its context) is paramount. Context engineering is the systematic process of preparing, optimizing, and maintaining this context data [29]. This involves ensuring complete metadata, proper data chunking, and clean vector arrays. Poor context is a major source of unreliable AI outputs [29].
- A3: Implement a Robust MLOPs Framework: A mature MLOps practice is critical for production-ready AI. This includes [28] [30]:
- Version Control: For data, models, and code.
- Real-Time Monitoring: For model performance, data drift, and concept drift.
- Automated Pipelines: For training, evaluation, and deployment.
- Security-First Design: Incorporating controls and audit trails to protect AI systems [30].
Q: The integration between our data sources, AI models, and laboratory execution systems is complex and fragile. Are there standards to simplify this?
Yes, the ecosystem is moving towards standardization to reduce integration complexity.
- A1: Leverage the Model Context Protocol (MCP): MCP is emerging as a universal standard, acting as a "USB-C for AI." It allows AI applications to connect to any data source or tool (e.g., databases, CRMs, laboratory instruments) without requiring custom integrations for each one. This simplifies architecture and maintenance while also standardizing governance and logging [29].
- A2: Use a Unified Data Catalog: To prevent vendor lock-in and ensure platform interoperability, consider using a neutral data catalog like AWS Glue. It can serve as a flexible data access layer when integrated with platforms like Databricks and Snowflake, allowing you to maintain control over your data strategy [28].
Experimental Protocols & Methodologies
Protocol: Simulating DBTL Cycles for ML Model Benchmarking
This protocol, adapted from scientific literature, allows for the systematic testing and optimization of machine learning methods over multiple DBTL cycles without the cost of real-world experiments [15].
1. Objective: To create a framework for comparing the performance of different machine learning models and recommendation algorithms in guiding iterative combinatorial pathway optimization.
2. Background: Public data from multiple, real DBTL cycles is scarce. Simulated data using mechanistic models overcomes this limitation and allows for the controlled benchmarking of strategies [15].
3. Methodology:
- Step 1: Construct a Mechanistic Kinetic Model.
- Develop or use an existing kinetic model (e.g., in the SKiMpy package) that represents your metabolic pathway of interest embedded in a physiologically relevant cell model [15].
- The model should use ordinary differential equations (ODEs) to describe changes in metabolite concentrations. Kinetic parameters should represent biologically relevant quantities (e.g., enzyme concentrations, catalytic rates) [15].
- Integrate the pathway model into a basic bioprocess model (e.g., a batch reactor) to simulate realistic conditions [15].
- Step 2: Define the Design Space and Perturbations.
- Identify the pathway enzymes to be optimized.
- Define a library of possible perturbations (e.g., 5 different expression levels for each enzyme) achieved by modulating parameters like
V_maxin the model, simulating the effect of using different promoters or RBS sequences [15].
- Step 3: Generate Initial Training Data.
- Randomly sample a set of initial strain designs (e.g., 50 different combinations of enzyme levels) from the defined library.
- Use the kinetic model to simulate the product flux (titer/yield/rate) for each design, generating the target variable for ML training [15].
- Step 4: Train, Validate, and Recommend.
- Train a suite of ML models (e.g., Gradient Boosting, Random Forest) on the initial dataset to predict product flux from enzyme levels [15].
- Use a recommendation algorithm on the trained models to propose a new set of promising strain designs for the next "build" phase, balancing exploration and exploitation [15].
- Step 5: Iterate and Benchmark.
- Simulate the next DBTL cycle by generating data for the recommended designs using the kinetic model.
- Update the ML models with the new data and repeat. Compare the performance of different ML and recommendation strategies over multiple simulated cycles based on the time taken to find the optimal production strain [15].
Key Workflow Diagram
This diagram illustrates the automated, knowledge-driven DBTL cycle for metabolic engineering, integrating both in vitro and in vivo experimentation [31].
Protocol: Troubleshooting an AI-Powered Chatbot for Experimental Data Querying
Many research teams deploy AI assistants to help query internal data. This protocol provides a triage flow for when these systems provide wrong or inconsistent answers [32].
1. Objective: To systematically diagnose and resolve issues of inaccuracy in an AI-powered research data assistant.
2. Methodology:
- Step 1: Reproduce and Isolate the Issue.
- Step 2: Inspect the Retrieval System (Most Common Cause). The problem is often weak "grounding," where the AI lacks access to the correct information [32].
- Check Retrieval Hit Rate: Verify that the system is actually retrieving relevant documents for the query.
- Inspect Top-K Docs: Examine the top documents (e.g., the top 5) that were fed into the model's context. Are they the correct and most up-to-date research documents or data summaries?
- Check Index Freshness: Is the document index stale? Has new experimental data been added that hasn't been indexed? [32].
- Step 3: Inspect the Model Call.
- Check Token Counts: Excessively long prompts can lead to high latency and may cause the model to ignore later context.
- Review Parameters: Check if the
temperatureparameter is set too high, introducing excessive randomness. Lowering it makes outputs more deterministic [32]. - Analyze the System Prompt: Ensure the instructions to the model are clear and unambiguous.
- Step 4: Implement Fixes.
- Fast Fixes: Narrow the assistant's scope, require citations for answers, lower the
temperature, and add a safe fallback message for low-confidence answers [32]. - Long-Term Fixes: Implement Retrieval Augmented Generation (RAG). Improve document chunking strategies and add better metadata. Establish a schedule to regularly rebuild the search index [32].
- Fast Fixes: Narrow the assistant's scope, require citations for answers, lower the
Data Validation Workflow Diagram
This flowchart outlines the logical steps for validating data quality and model inputs within an AI-driven analytical pipeline, a critical step before model training or inference.
The Scientist's Toolkit: Research Reagent Solutions
The following table details key resources and computational tools essential for implementing AI-driven data analysis within automated DBTL cycles.
| Item | Function / Application |
|---|---|
| Cell-Free Protein Synthesis (CFPS) System | A crude cell lysate system used for upstream in vitro testing of metabolic pathways. It bypasses cellular membranes and internal regulation, allowing for rapid prototyping and optimization of enzyme expression levels before moving to more time-consuming in vivo strain engineering [31]. |
| Mechanistic Kinetic Model (e.g., SKiMpy) | A computational model using ordinary differential equations to represent a metabolic pathway embedded in cell physiology. It is used to simulate DBTL cycles, generate training data for ML models, and benchmark optimization strategies without the cost of wet-lab experiments [15]. |
| Ribosome Binding Site (RBS) Library | A key tool for in vivo fine-tuning of synthetic biological pathways. A library of RBS sequences with varying strengths (e.g., modulated by changing the Shine-Dalgarno sequence) allows for precise control of the translation initiation rate of multiple enzymes simultaneously, enabling combinatorial optimization of pathway flux [31]. |
| Data Version Control (e.g., lakeFS) | A system that applies git-like version control to large datasets stored in data lakes. It is critical for maintaining reproducibility across DBTL iterations, enabling branching, merging, and rolling back of data, and implementing engineering best practices for data products [28]. |
| Model Context Protocol (MCP) | A universal standard protocol that acts as "USB-C for AI," allowing AI applications to connect seamlessly to various data sources, databases, and laboratory instrument APIs without requiring custom integrations for each one. This drastically reduces integration complexity and maintenance [29]. |
| Vector Database | A specialized database designed to store and query high-dimensional vector embeddings of data (e.g., text from research papers, protein sequences). It is the de facto infrastructure for Retrieval-Augmented Generation (RAG) applications, which ground AI responses in relevant source material [29]. |
Performance Metrics Table
Tracking the right metrics is essential for evaluating the success of your AI-enhanced DBTL pipeline. The following table summarizes key quantitative indicators.
| Metric | Description | Target / Application |
|---|---|---|
| Product Titer/Yield/Rate (TYR) | The concentration, yield, and production rate of the target molecule (e.g., dopamine, a therapeutic protein) [15]. | The primary optimization objective in metabolic engineering and bioprocess development. Example: A dopamine production strain achieving 69.03 ± 1.2 mg/L [31]. |
| Grounded Accuracy | The percentage of AI-generated answers that correctly match and are supported by the provided source data [32]. | Critical for AI research assistants. Should be measured using human-labeled data with a target as close to 100% as possible [32]. |
| Containment Rate | The percentage of conversations or queries solved entirely by an AI assistant without requiring human intervention [32]. | A key efficiency metric for AI support tools. The target should be set by use case and complexity [32]. |
| ROI from MLOps | The return on investment from implementing a mature MLOps framework. | Organizations report 189% to 335% ROI over three years from improved deployment efficiency and reduced operational costs [30]. |
| Data Scientist Productivity | The improvement in the output efficiency of data science teams. | Comprehensive MLOps strategies can lead to a 25% improvement in data scientist productivity by automating workflows and standardizing processes [30]. |
The Role of Real-Time Data Streaming and Processing in the 'Test' Phase
The Design-Build-Test-Learn (DBTL) cycle is a foundational framework in metabolic engineering and strain development for optimizing the production of compounds, such as pharmaceuticals or biofuels [31] [15]. The 'Test' phase is critical, where built microbial strains are evaluated to generate performance data. Integrating real-time data streaming and processing into this phase transforms it from a static, endpoint assessment into a dynamic, continuous source of actionable insights. This enables researchers to monitor bioprocesses as they happen, detect anomalies instantly, and make data-driven decisions to guide the subsequent 'Learn' and 'Design' phases more effectively [33] [34]. This technical support article addresses common challenges and provides protocols for implementing these powerful tools within automated DBTL research.
Key Concepts and Definitions
- Real-Time Data Streaming: The continuous ingestion, processing, and analysis of data as it is generated, with minimal latency between data creation and availability for insights [33] [35].
- Stream Processing: The technology that performs real-time analysis on data streams, allowing for transformations, aggregations, and anomaly detection as data flows [33].
- DBTL Cycle: An iterative workflow for microbial strain development comprising Design (planning genetic modifications), Build (genetic construction), Test (strain characterization and bioprocessing), and Learn (data analysis to inform the next cycle) [31] [15].
Frequently Asked Questions (FAQs)
1. How can real-time data streaming specifically accelerate our 'Test' phase experiments? Real-time data streaming directly shortens the feedback loop within the DBTL cycle. Instead of waiting for a batch process to conclude and then conducting offline, time-consuming analyses, you can monitor key process indicators—like biomass, substrate consumption, or product formation—live. This allows for:
- Immediate Intervention: Detect and correct process anomalies (e.g., sudden pH changes, oxygen depletion) before they ruin an experiment [33] [35].
- Dynamic Control: Adjust process parameters in real-time to maintain optimal production conditions, maximizing yield for every experimental run [33].
- Faster Cycle Times: As data is processed and available instantly, the subsequent 'Learn' phase can begin sooner, accelerating the overall iteration of DBTL cycles [15].
2. Our data comes from multiple bioreactors and analyzers. How do we ensure consistency and quality in the streaming data? This is a common challenge. A robust streaming architecture is key to managing data from diverse sources [33] [36].
- Standardize Data Ingestion: Use a scalable ingestion tool like Apache Kafka or Amazon Kinesis to collect data from all sources into a single platform [33] [35].
- Implement Pre-Processing: Perform data validation, cleansing, and standardization (e.g., unit conversion, timestamp synchronization) as the first step in your stream processing pipeline. This ensures that downstream analyses are based on consistent, high-quality data [33] [36].
- Handle Out-of-Order Data: Choose a stream processing framework (e.g., Apache Flink) that can buffer and re-order data packets based on the actual event time to ensure analytical accuracy [35] [36].
3. What are the best practices for storing and managing the high-volume data generated from continuous bioprocess monitoring?
- Adopt a Multi-Tiered Strategy [35]:
- Hot Storage: Use in-memory databases or the internal storage of your streaming platform for real-time access to the most recent data for live dashboards and alerting.
- Warm Storage: Use cloud object stores (e.g., AWS S3) for recent data that requires quick retrieval for further analysis.
- Cold Storage: Archive historical data in cost-effective storage solutions for long-term trend analysis and regulatory purposes.
- Use Efficient Compression: Apply compression algorithms to reduce data size and minimize storage costs and bandwidth usage [35].
Troubleshooting Guides
Issue 1: High Latency in Data Processing Pipeline
Symptoms: Alerts for process anomalies are delayed; real-time dashboards are not updating promptly. Possible Causes and Solutions:
| Cause | Solution |
|---|---|
| I/O Bottlenecks | Minimize disk I/O by processing data in-memory wherever possible. Avoid excessive use of intermediate topics in message brokers like Kafka [34]. |
| Insufficient Resources | Monitor system metrics and use autoscaling (e.g., via Kubernetes) to dynamically add more processing nodes as the data load increases [35] [36]. |
| Inefficient Processing Logic | Optimize stream processing algorithms and leverage in-memory computations. Use tools with native support for time-series data to reduce processing overhead [34] [36]. |
| Network Protocol Overhead | Optimize data serialization/deserialization and use efficient data transport protocols [35]. |
Symptoms: Gaps in data streams; nonsensical readings disrupting analytical models. Possible Causes and Solutions:
| Cause | Solution |
|---|---|
| Unreliable Network Connectivity | Implement edge processing. Deploy lightweight algorithms to edge devices or local gateways to perform initial data filtering, reduction, and caching when connection is lost [36]. |
| Faulty Sensors or Calibration Drift | Establish a regular sensor calibration and maintenance schedule. Implement data validation rules at the ingestion point to flag and route anomalous readings for review [33]. |
| Packet Loss or Out-of-Order Delivery | Use a streaming platform that can buffer, shuffle, and re-order data packets based on the original event timestamp before analysis [36]. |
Issue 3: Difficulty Scaling the Platform with Experimental Throughput
Symptoms: System performance degrades as more bioreactors or analytical instruments are brought online. Possible Causes and Solutions:
| Cause | Solution |
|---|---|
| Non-Scalable Architecture | Design your system with horizontal scaling in mind. Use a platform that supports easy partitioning of data streams, allowing multiple processes to handle different segments in parallel [33] [35]. |
| Improper Resource Allocation | Use container orchestration tools (e.g., Kubernetes) to deploy streaming components. Implement continuous monitoring and autoscaling policies to adjust CPU and memory resources based on real-time demand [35]. |
| Monolithic Processing Pipelines | Break down processing into smaller, independent microservices. This allows each service to be scaled independently based on its specific load [35]. |
Experimental Protocols for the 'Test' Phase
Protocol 1: Real-Time Monitoring of a Fed-Batch Fermentation for Metabolite Production
Objective: To continuously track key process variables and product formation to maintain optimal production conditions and gather high-quality data for the 'Learn' phase.
Methodology:
- Instrument Setup: Calibrate in-line sensors for pH, dissolved oxygen (DO), and temperature. Connect an automated sampling system to an HPLC or mass spectrometer for near-real-time quantification of metabolites and substrates.
- Data Ingestion: Configure a stream ingestion tool (e.g., Apache Kafka) to collect data from all sensors and analyzers. Each data point should be timestamped at the source.
- Stream Processing:
- Use a processing framework (e.g., Apache Flink) to clean and synchronize the incoming data streams.
- Calculate derived metrics in real-time, such as specific growth rate or product yield.
- Implement a machine learning model for anomaly detection to flag deviations from expected process trajectories [33] [34].
- Output and Action:
- Feed processed data to a real-time dashboard for visualization.
- Set up automated alerts to notify researchers if key parameters (e.g., DO, product titer) fall outside predefined thresholds.
- Implement simple feedback control loops (e.g., to add base to control pH).
Protocol 2: High-Throughput Screening with Real-Time Data Integration
Objective: To rapidly process and analyze data from microtiter plates or similar high-throughput formats, enabling immediate prioritization of strains for further study.
Methodology:
- Automated Assays: Use robotic systems to perform assays (e.g., fluorescence, absorbance) on many strains in parallel.
- Continuous Data Collection: Configure plate readers and other instruments to stream raw data output continuously to a central ingestion point as measurements are taken.
- Real-Time Analysis:
- Apply Streaming SQL or similar technology to calculate performance metrics (e.g., fluorescence intensity per OD600) for each strain as the data arrives [34].
- Use a stateful stream processing application to aggregate results per strain across multiple time points.
- Instantaneous Ranking: Implement a logic module that ranks strains based on pre-defined performance criteria (e.g., highest product yield, fastest growth) in real-time. The top-performing strains can be automatically flagged for the 'Build' phase of the next DBTL cycle.
The Scientist's Toolkit: Research Reagent Solutions
The following table details key technologies and materials essential for implementing real-time data streaming in the 'Test' phase.
| Item | Function in the 'Test' Phase |
|---|---|
| Apache Kafka | A distributed event streaming platform used for high-throughput, reliable ingestion of data from multiple sources into a unified data pipeline [33] [35]. |
| Apache Flink | A powerful stream processing framework that supports complex event processing, stateful computations, and low-latency analytics, crucial for real-time bioprocess monitoring [33] [35]. |
| In-line Sensors (pH, DO) | Generate continuous, real-time data on critical process parameters, providing the fundamental input for the streaming pipeline [35]. |
| Cloud Object Storage (e.g., AWS S3) | Provides scalable and cost-effective storage for the vast amounts of time-series data generated during experiments, supporting long-term data retention for the 'Learn' phase [35]. |
| Streaming SQL | A query language that allows researchers and data engineers to define data transformations and analyses on continuous data streams using a familiar SQL-like syntax, speeding up development [34]. |
The following table summarizes quantitative data on the growth and performance of the real-time analytics and streaming tools market, underscoring the strategic importance of this technology.
Table: Market Growth Projections for Real-Time and Streaming Analytics
| Market Segment | 2023/2024 Value | 2029/2032 Projection | Compound Annual Growth Rate (CAGR) | Source Citation |
|---|---|---|---|---|
| Real-Time Analytics Market | USD 51.35B (2024) | USD 137.38B (2034) | 10.31% | [37] |
| Streaming Analytics Market | USD 29.53B (2024) | USD 125.85B (2029) | 33.6% | [37] |
| Real Time Data Streaming Tools Market | ~USD 10.2B (2023) | USD 35.3B (2032) | 18.5% (2024-2032) | [37] |
| Data Analytics Market | USD 64.99B (2024) | USD 402.70B (2032) | 25.5% | [37] |
Applying Process Intelligence and Mining to Map and Optimize DBTL Variants
The Design-Build-Test-Learn (DBTL) cycle is a foundational framework in synthetic biology and metabolic engineering for the iterative development of microbial strains and biological systems. Process intelligence and mining techniques are now being applied to these cycles to map complex variant relationships and optimize entire workflows with minimal human intervention. This technical support center addresses the key challenges researchers face when implementing these advanced, automated pipelines, providing troubleshooting guidance and proven methodologies to enhance your DBTL iteration research.
FAQs and Troubleshooting Guides
FAQ 1: What is the role of machine learning in automating the DBTL "Learn" phase, and how is the exploration-exploitation trade-off managed?
Answer: Machine learning, particularly Gaussian Process Regression (GPR), is employed in the "Learn" phase to create predictive models of biological system behavior, such as predicting Translation Initiation Rates (TIR) for Ribosome Binding Sites (RBS) or fitness of enzyme variants [38] [39]. GPR is favored because it provides both a predicted mean (expected performance) and a measure of uncertainty (variance) for each potential variant, even with relatively small, high-quality datasets [38].
The management of the exploration-exploitation trade-off is handled in the "Design" phase by a class of algorithms called multi-armed bandits, specifically the Upper Confidence Bound (UCB) or Bayesian optimization with an Expected Improvement (EI) acquisition function [38] [40].
- Exploitation involves choosing variants the model predicts will be high-performing.
- Exploration involves choosing variants where the model's predictions are highly uncertain, which can lead to discovering better-performing regions of the design space.
Bayesian optimization automatically balances these two factors, deciding on the next batch of experiments to run by selecting variants that offer the highest expected improvement over the current best, thereby reducing the total number of experiments needed to find an optimum [40].
FAQ 2: Our automated DBTL platform is running, but the learning cycle is slow. What are the primary bottlenecks, and how can we mitigate them?
Answer: The "Test" phase is often the primary throughput bottleneck in the DBTL cycle [41]. Slow data generation delays the "Learn" phase and subsequent iterations. Mitigation strategies include:
- Automated Analytics: Implement high-throughput, automated analytical technologies for multi-omics systems biology (genome, transcriptome, proteome, metabolome) to accelerate data acquisition [41].
- Integrated Robotic Platforms: Utilize fully automated biofoundries, like the Illinois Biological Foundry for Advanced Biomanufacturing (iBioFAB), to integrate laboratory automation with machine learning. This creates a continuous, closed-loop system where algorithms design experiments and robotics execute them, dramatically speeding up cycle turnover [40] [39].
- Optimized Assays: Develop and use automation-friendly, high-throughput quantification assays, such as functional enzyme assays that can be run in 96-well plates and automated via a central robotic arm [39].
FAQ 3: How can we ensure the reliability and accuracy of data generated in an automated, high-throughput DBTL pipeline?
Answer: High-quality, reliable data is essential for training effective machine learning models. Key methods to ensure data fidelity include:
- Automation for Consistency: Using robotic systems for liquid handling, colony picking, and assays minimizes human error and operational biases, leading to more consistent and objective data [41] [42].
- Modular Workflow Design: Dividing the end-to-end workflow into separate, robust automated modules (e.g., mutagenesis PCR, DNA assembly, transformation, protein expression, assays) allows for easier troubleshooting and recovery without restarting the entire process [39].
- Sequence Verification: While continuous workflow is ideal, random sequencing of constructed variants (e.g., with ~95% accuracy) is crucial for validating automated construction steps, such as a HiFi-assembly based mutagenesis method [39].
FAQ 4: What computational tools are available for the initial "Design" of genetic variants, especially for creating a high-quality starting library?
Answer: The initial library design is critical for the success of an engineering campaign. A combination of tools can be used to maximize diversity and quality:
- Pathway and Enzyme Selection: Tools like RetroPath and Selenzyme can be used for automated in silico selection of biosynthetic pathways and suitable enzymes for a target compound [42].
- Genetic Part Design: Software like PartsGenie helps in designing reusable DNA parts, optimizing elements like ribosome-binding sites (RBS) and codon usage for enzyme coding regions [42].
- AI-Powered Protein Design: For protein engineering, large language models (LLMs) trained on protein sequences (e.g., ESM-2) and epistasis models (e.g., EVmutation) can predict the fitness of amino acid substitutions, generating a high-quality, diverse list of initial variants to screen [39].
FAQ 5: How do we effectively navigate the vast combinatorial space of possible genetic variants with a limited experimental budget?
Answer: Efficiently exploring a large combinatorial design space requires strategic library reduction and intelligent sampling:
- Design of Experiments (DoE): Apply statistical methods like orthogonal arrays and Latin squares to reduce thousands of possible genetic construct combinations down to a small, representative library for initial testing. This allows for efficient exploration of the design space with a tractable number of samples [42].
- Bayesian Optimization: This is ideal for "black-box" optimization problems where experiments are expensive. It uses a probabilistic model to guide the selection of which variants to test next, focusing experimental resources on the most promising areas of the sequence space. This approach has been shown to evaluate less than 1% of all possible variants while significantly outperforming random screening [40].
Experimental Protocols and Methodologies
Protocol 1: Machine Learning-Guided RBS Optimization
This protocol details an automated DBTL cycle for optimizing bacterial Ribosome Binding Sites (RBS) to maximize protein expression, utilizing Gaussian Process Regression and a Bandit algorithm [38].
- Design: Define the experimental space of RBS sequences (e.g., a 20 bp sequence upstream of the coding sequence). The initial design can be based on a known benchmark RBS sequence.
- Build: Use laboratory automation and high-throughput processes to synthesize the RBS variant libraries. This ensures reliable and scalable physical construction of the genetic designs.
- Test: Transform the variants into a microbial host (e.g., E. coli) and measure the output (e.g., fluorescence if expressing GFP) to determine the Translation Initiation Rate (TIR) for each variant. This is performed using automated analytics.
- Learn: Train a Gaussian Process Regression (GPR) model on the collected TIR data. The GPR will predict the mean TIR and a confidence level (variance) for all unevaluated RBS sequences in the design space.
- Iterate: A Bandit algorithm (e.g., Upper Confidence Bound) uses the GPR predictions to recommend the next batch of RBS variants to test, balancing the exploration of uncertain sequences with the exploitation of sequences predicted to be high-performing. Return to step 2.
Protocol 2: Autonomous Enzyme Engineering for Improved Activity
This generalized platform integrates large language models with biofoundry automation to engineer enzymes, requiring only an input protein sequence and a quantifiable fitness assay [39].
- Design:
- Input: Provide the wild-type protein sequence (e.g., Arabidopsis thaliana halide methyltransferase, AtHMT).
- Library Generation: Use a combination of a protein LLM (ESM-2) and an epistasis model (EVmutation) to generate a diverse and high-quality list of initial single-point mutants (e.g., 180 variants).
- Build:
- Utilize an automated biofoundry (e.g., iBioFAB).
- Implement a high-fidelity (HiFi) assembly-based mutagenesis method to construct the variant library without the need for intermediate sequence verification, enabling a continuous workflow.
- Test:
- The robotic platform executes automated modules for transformation, protein expression, and a functional enzyme assay (e.g., measuring ethyltransferase activity for AtHMT).
- Data on variant fitness is automatically collected and processed.
- Learn:
- The assay data is used to train a low-data (low-N) machine learning model to predict variant fitness.
- Iterate:
- The trained ML model is used to design the next library, typically by adding new mutations to the best-performing variants from previous rounds.
- The platform autonomously executes subsequent DBTL cycles. In a proof-of-concept, four rounds over four weeks successfully engineered enzyme variants with ~16-fold improved activity [39].
DBTL Workflow and Signaling Pathways
DBTL Cycle Workflow with AI Integration
This diagram visualizes the core structure of an automated, AI-powered DBTL cycle, illustrating the flow of information and materials between its components and the central role of machine learning.
Automated Laboratory Information Flow
This diagram details the flow of information and control in a fully automated platform, showing how the AI controller interacts with the physical laboratory hardware.
Research Reagent Solutions
The following table lists key materials and reagents essential for implementing automated DBTL cycles, as featured in the cited research.
| Item/Reagent | Function in Experiment | Example Usage in DBTL Cycle |
|---|---|---|
| Ribosome Binding Site (RBS) Libraries [38] | Control translation initiation rate and protein expression level. | Optimized in ML-guided DBTL cycles to increase target protein yield by up to 34% [38]. |
| Enzyme Variant Libraries [39] | Provide sequence diversity for screening and optimizing enzymatic properties like activity or specificity. | Designed using protein LLMs (ESM-2) and epistasis models; built via HiFi-assembly mutagenesis [39]. |
| Ligase Cycling Reaction (LCR) [42] | Enable robust, automated assembly of combinatorial pathway libraries from DNA parts. | Used in automated platform for assembling reduced-design libraries of flavonoid pathways [42]. |
| Host Chassis (e.g., E. coli) [42] | Microbial host for expressing constructed genetic pathways and producing the target molecule. | Engineered for production of fine chemicals like (2S)-pinocembrin in automated DBTL pipelines [42]. |
| DNA Parts & Plasmid Backbones [42] | Modular genetic components (promoters, genes, origins) for constructing and tuning expression pathways. | Varied in copy number and promoter strength to explore design space in statistical DoE libraries [42]. |
Low-Code Platforms for Empowering Scientists in Workflow Creation
Technical Support Center: FAQs & Troubleshooting Guides
Section 1: Platform Selection & Setup
FAQ: What is a low-code platform and how can it specifically help my research team?
A low-code development platform (LCDP) is a software development approach that uses visual, drag-and-drop interfaces and pre-built components to create applications with minimal manual coding [43] [44]. In a research context, it empowers scientists to build and automate their own digital tools without relying heavily on software developers. This directly addresses key bottlenecks in the automated Design-Build-Test-Learn (DBTL) cycle by enabling rapid prototyping and iteration of digital workflows, drastically reducing development time and fostering scientific agility [43] [45].
FAQ: How do I choose between a low-code and a no-code platform for my lab's needs?
The choice depends on the complexity of your workflows and the technical comfort of your team. Use the following table as a guide:
| Platform Type | User Profile | Coding Required | Complexity Handling | Ideal Use Case in Research |
|---|---|---|---|---|
| Low-Code | Technical users, hybrid teams, "citizen developers" [45] | Some coding for customization [45] | Complex applications and logic [45] | Integrating diverse instruments with unique protocols; custom data processing pipelines [43] [44] |
| No-Code | Non-technical users (e.g., biologists, chemists) [45] | No coding needed [45] | Simple, routine tasks and apps [45] | Simple sample tracking dashboards; standardized data entry forms; basic report generation [45] |
Troubleshooting Guide: Platform Performance is Slow
- Problem: Applications or automated workflows built on the low-code platform run slowly, especially with large datasets.
- Background: This is a common issue when moving from a small prototype to a production-level experiment with substantial data.
- Solution:
- Check Data Processing Steps: Use the platform's visual monitoring tools to identify which step in the workflow is the bottleneck. Look for complex loops or data transformations [45] [46].
- Optimize Data Handling:
- Methodology: For datasets exceeding a few thousand rows, implement "data pagination" (loading data in chunks) instead of loading entire datasets into memory at once. For programmatic solutions, use efficient data handling libraries like
pandasin Python [46]. - Validation: Compare task completion times before and after optimization using the platform's built-in logs.
- Methodology: For datasets exceeding a few thousand rows, implement "data pagination" (loading data in chunks) instead of loading entire datasets into memory at once. For programmatic solutions, use efficient data handling libraries like
- Review External Connections: Slowdowns can be caused by external databases or instruments. Check the response times of all connected systems and APIs [46].
Section 2: Implementation & Integration Challenges
FAQ: Our lab uses many different instruments with varying data formats. Can a low-code platform handle this integration?
Yes, this is a primary strength of low-code platforms. They are designed to act as an orchestration layer, integrating disparate systems [47]. They provide pre-built connectors and robust API capabilities to bridge communication gaps between different device types and software, creating a unified workflow from heterogeneous data sources [43] [44] [45].
Troubleshooting Guide: Failure to Connect to a Laboratory Instrument
- Problem: The low-code platform cannot establish a connection to a specific piece of lab equipment (e.g., an HPLC or mass spectrometer).
- Background: Instruments may use outdated communication protocols or proprietary data formats.
- Solution:
- Verify Communication Protocol: Confirm the instrument's output protocol (e.g., direct database write, file export, API, serial communication). Consult the instrument's technical manual.
- Check for a Pre-built Connector: Search the low-code platform's connector library for your instrument model or manufacturer.
- Develop a Custom Connector (if needed):
- Methodology: If no pre-built connector exists, a custom solution is required. This may involve:
- Data Ingestion: Using ETL (Extract, Transform, Load) tools or writing a lightweight script to parse data from files (e.g., CSV, JSON) generated by the instrument [46].
- API Integration: Building a custom API integration using frameworks like FastAPI to create a bridge between the instrument's software and the low-code platform [48].
- Validation: Test the connection with a small, non-critical data set first. Ensure all data fields are mapped correctly and timestamps are accurate.
- Methodology: If no pre-built connector exists, a custom solution is required. This may involve:
Diagram 1: Instrument Integration Troubleshooting Path
Section 3: Data Management & Standardization
FAQ: How can we ensure data consistency and quality when automating workflows?
Automation requires high-quality, standardized input data. Implement these protocols before full automation [46]:
- Define Data Models: Establish clear, lab-wide standards for naming conventions, required metadata (e.g., sample ID format, units), and data structure for each experiment type.
- Use Validation Rules: Leverage the low-code platform's logic blocks to create data validation rules at the point of entry (e.g., range checks, unit consistency, mandatory field completion) [48].
- Implement Preprocessing: Build automated data cleaning steps into your workflow to handle missing values, normalize units, and flag outliers [46].
Troubleshooting Guide: Automated Workflow Produces Incorrect Results
- Problem: A previously reliable automated data processing pipeline begins generating erroneous outputs.
- Background: This is often a "garbage in, garbage out" issue. A change in the input data format or an unexpected data value can break the workflow.
- Solution:
- Audit the Input Data: Manually inspect the most recent raw data inputs. Look for changes in file format, column headers, units, or the presence of unexpected special characters or null values [46].
- Check Transformation Logic: Review the visual logic in your workflow. A common fault is a hard-coded value (e.g., a specific column index) that is no longer valid after a minor change in the data source.
- Review Audit Trails: Use the platform's automatic logging and version control features to identify exactly when the error first occurred and what data was being processed at that time [46]. This is critical for reproducibility and debugging.
Diagram 2: Data Error Diagnosis Workflow
Section 4: Compliance, Validation & Security
FAQ: Are applications built with low-code platforms suitable for regulated environments (e.g., GxP, FDA 21 CFR Part 11)?
Yes, but they require a disciplined approach. Many enterprise-grade low-code platforms are designed with compliance in mind [45]. The key is to implement and document proper validation procedures for any application used in a regulated process. This includes maintaining automatic audit trails, version control for workflows, and role-based access control [46].
Troubleshooting Guide: Failing a Compliance Audit for an Automated Workflow
- Problem: An internal or external audit flags an automated workflow for non-compliance.
- Background: This typically stems from insufficient documentation, lack of validation, or inadequate security controls.
- Solution:
- Gather All Documentation: Compile the Software Development Life Cycle (SDLC) documents, including the Quality Plan, Implementation Plan, and Test Plans for the workflow [46].
- Demonstrate Data Integrity:
- Methodology: Provide evidence from the platform's immutable logs showing a complete audit trail. This should timestamp every data change, user action, and system event related to the workflow [46].
- Validation Report: Present the validation package that proves the workflow performs as intended under all tested conditions.
- Verify Access Controls: Show that role-based access control (RBAC) is correctly configured, ensuring only authorized personnel can view or modify the workflow and its data [46].
The Scientist's Toolkit: Research Reagent Solutions
The following table details key digital "reagents" – software tools and platforms that are essential for building and integrating automated workflows in a modern research environment.
| Tool / Platform | Type | Primary Function in Workflow Automation |
|---|---|---|
| Appian | Low-Code Platform [47] [45] | Orchestrates complex, multi-step processes across systems; strong in compliance and auditability for regulated environments [47] [45]. |
| KNIME | Visual Analytics Platform [48] | Provides a free-tier platform for building and executing data blending, preprocessing, and analysis workflows without extensive coding [48]. |
| Benchling | Informatics Platform (ELN) | Serves as a central hub for experimental data and protocols, providing structured data that can be integrated into broader automation pipelines [48]. |
| CDD Vault | Data Management Platform | Offers secure, industry-grade data management for biological and chemical research, acting as a reliable data source or destination for automated workflows [48]. |
| Apache Airflow | Workflow Orchestration Tool | Enables the scheduling, monitoring, and automation of complex data pipelines across the entire tech stack, often managed via Python scripts [48]. |
| FastAPI | Framework [48] | Used to build custom, high-performance APIs that bridge unique or proprietary lab systems with low-code platforms and other tools [48]. |
Agentic AI and its Emerging Role in Autonomous Experimental Design and Execution
Frequently Asked Questions (FAQs) & Troubleshooting
Q1: Our AI agent seems to get stuck in repetitive design loops. How can we break this cycle?
- Issue: This is often caused by a lack of diverse hypothesis generation or failure-driven exploration.
- Solution: Implement the principle of Continuous Hypothesis Generation [49]. Configure your agent to constantly scan live data streams and performance metrics for anomalies or new trends, ensuring a fresh influx of testable ideas. Additionally, ensure your system has Failure-Driven Exploration capabilities, where the agent actively analyzes unsuccessful experiments to extract insights and design stronger follow-up tests [49].
Q2: How can we ensure our autonomous experiments remain scientifically valid without constant human oversight?
- Issue: Concerns about statistical rigor in fully automated cycles.
- Solution: Leverage Autonomous Control Group Management [49]. The AI agent should be equipped to automatically design, assign, and maintain statistically valid control groups for each experiment. This removes human bias and ensures the validity of results at scale. Furthermore, using Multi-Metric Optimization prevents the agent from over-optimizing a single KPI at the expense of others, leading to more robust and reliable outcomes [49].
Q3: We are not achieving the promised acceleration in our Design-Make-Test-Analyze (DMTA) cycles. What could be the bottleneck?
- Issue: Sequential execution of DMTA phases instead of parallelization.
- Solution: Adopt a Parallelized Experimentation approach [49]. Instead of running tests one after another, design your agentic system to execute dozens of experimental variations concurrently across different segments or conditions. This mirrors advanced systems like Tippy, which uses specialized agents (Molecule, Lab, Analysis) that can operate in a coordinated, overlapping manner to dramatically reduce cycle times [50].
Q4: An experiment failed unexpectedly due to an external market event. How can future tests account for this?
- Issue: Experiments are run without considering external context.
- Solution: Implement Context-Aware Testing [49]. Your agent should be designed to factor in external and internal context, such as market trends, seasonal demand, or operational constraints, when designing and running experiments. This prevents wasted resources on tests whose results would be skewed by external events.
Quantitative Performance Data
The effectiveness of Agentic AI systems is demonstrated through significant improvements in key operational metrics. The data below summarizes the performance gains observed in automated experimentation and drug discovery cycles.
Table 1: Performance Metrics of Agentic AI Systems in Experimental Automation
| Performance Metric | Traditional Approach | Agentic AI Approach | Improvement | Source / System |
|---|---|---|---|---|
| Molecule Processing Rate | ~2,000-3,000 molecules/second (8 CPU, center-of-mass method) | >1,000,000 molecules/second (on GPU, MLE fitting) | ~333x faster | GraspJ (Super-resolution imaging) [51] |
| DMTA Cycle Execution | Sequential phases, significant delays | Parallel & overlapping execution via specialized agents | "Significant improvements" in workflow efficiency & decision-making speed | Tippy (Drug discovery) [50] |
| Hypothesis-to-Insight Time | Weeks or months | Hours | Reduction from weeks to hours | Autonomous Experimentation Principles [49] |
| Experiment Concurrency | Single or few tests at a time | "Hundreds of tests in parallel" | Massive increase in testing throughput | Autonomous Experimentation Principles [49] |
Table 2: Capabilities of Specialized AI Agents in the DMTA Cycle (as in the Tippy System)
| Specialized Agent | Core Function | Key Tools/Actions |
|---|---|---|
| Supervisor Agent | Central coordination & workflow orchestration | Manages task delegation, understands project objectives, facilitates agent handoffs [50] |
| Molecule Agent | Generates & optimizes molecular structures | Looks up known molecules, suggests similar compounds, converts names to SMILES notation [50] |
| Lab Agent | Manages laboratory automation & job execution | Creates and starts synthesis/analysis jobs, queries status, coordinates laboratory resources [50] |
| Analysis Agent | Processes data & extracts statistical insights | Uses retention time data (HPLC), performs activity duration analysis, guides molecular design [50] |
| Safety Guardrail Agent | Provides critical safety oversight | Validates requests for dangerous reactions, unauthorized access, or synthesis of controlled substances [50] |
Experimental Protocols
Protocol 1: Implementing a Multi-Agent AI System for an Autonomous DMTA Cycle
This protocol outlines the methodology for deploying a system like Tippy to automate iterative drug discovery.
System Architecture & Agent Specialization:
- Deploy five specialized AI agents: Supervisor, Molecule, Lab, Analysis, and Safety Guardrail [50].
- Equip each agent with domain-specific tools. For example, the Molecule Agent requires access to chemical databases and molecular property calculators, while the Lab Agent needs APIs to control HPLC systems and synthesis instrumentation [50].
Coordination Mechanism Setup:
- Configure the Supervisor Agent with hierarchical coordination logic to manage task delegation and workflow orchestration [50].
- Establish dynamic handoff mechanisms that allow agents to seamlessly pass data and control as a workflow progresses from Design (Molecule Agent) to Make and Test (Lab Agent) to Analyze (Analysis Agent) [50].
Safety Integration:
- Integrate the Safety Guardrail Agent to validate all user requests and agent-proposed actions before execution. This agent should use a fast, lightweight model to check for dangerous chemical reactions or procedures without impeding workflow efficiency [50].
Execution & Iteration:
- Initiate a cycle with a research objective input to the Supervisor Agent.
- The Supervisor delegates molecular design to the Molecule Agent, which proposes candidate compounds.
- Upon safety validation, the Lab Agent executes synthesis and testing jobs.
- The Analysis Agent processes the resulting data, derives insights, and feeds them back to the Supervisor.
- The Supervisor uses these insights to inform the next design iteration, closing the loop autonomously.
Protocol 2: Configuring an AI Agent for Parallelized and Adaptive Experimentation
This protocol details how to set up an AI agent for high-throughput, context-aware testing based on the principles of autonomous experimentation.
Infrastructure Deployment:
- Deploy the agent on cloud or distributed computing infrastructure to ensure scalability for parallel execution [49].
Hypothesis Generation Engine:
- Integrate the agent with real-time data feeds (e.g., live experimental data, CRM, market trends).
- Implement anomaly detection or trend recognition algorithms to automatically trigger the formulation of new testable hypotheses, ensuring a continuous pipeline of ideas [49].
Experimental Design & Parallelization:
- Use segmentation logic to distribute hundreds of experimental variations concurrently across different customer cohorts, product lines, or geographical regions [49].
- Apply automated result ranking to quickly identify top performers for broader rollouts.
Adaptive Execution:
- Build feedback checkpoints into the experiment workflow for mid-course evaluation.
- Integrate statistical monitoring (e.g., Bayesian updating) to allow the agent to adjust experimental parameters (variables, sample sizes) on the fly based on interim results, reallocating resources to the most promising variants [49].
Experimental Workflow Visualization
Autonomous DMTA Cycle with Multi-Agent AI Control
Closed-Loop Autonomous Experimentation Workflow
Research Reagent Solutions
Table 3: Essential Reagents and Materials for STORM/PALM Super-Resolution Imaging
This table details key reagents used in the experimental field from which performance data (GraspJ) was cited, illustrating the connection between AI analysis and physical laboratory work [51].
| Reagent/Material | Function | Example Use Case |
|---|---|---|
| Photoswitchable Fluorophores (e.g., Alexa 647, Cy3) | Emit light when activated; can be switched on/off. Allows precise localization of single molecules. | Paired as activator-reporter dyes (e.g., Cy3-A647) for STORM imaging of cellular structures like tubulin [51]. |
| Oxygen Scavenging System (Glucose Oxidase, Catalase) | Reduces photobleaching and photoblinking by removing oxygen from the imaging buffer. | Essential for maintaining fluorophore activity in PBS imaging buffer during prolonged STORM data acquisition [51]. |
| Primary Antibodies | Specifically bind to target proteins (antigens) within the sample. | e.g., Rat-anti-tubulin antibody used to label microtubule networks in fixed BSC-1 cells [51]. |
| Secondary Antibodies | Bind to primary antibodies, carrying the fluorescent labels for detection. | Custom-labeled secondary antibodies are conjugated with activator/reporter dye pairs for multiplexed imaging [51]. |
| Cysteamine | Acts as a switching/thiol agent in the imaging buffer, promoting the photoswitching of fluorophores. | Added to PBS imaging buffer at 100mM concentration to facilitate the cyclic activation of dyes [51]. |
Troubleshooting and Optimizing for Speed, Resilience, and ROI
Maintaining Test Automation ROI and Managing Execution Bottlenecks
Frequently Asked Questions (FAQs)
1. Our test automation suite is becoming slow and expensive to maintain. How can we improve its Return on Investment (ROI)? A positive ROI is achieved by maximizing the value gained from automation while minimizing the investment and maintenance costs [52]. Key strategies include automating high-value, repeatable scenarios like regression and smoke tests, integrating tests into your CI/CD pipeline for faster feedback, and investing in modular test design to reduce maintenance overhead [52]. Furthermore, treat your test suite as a core product by assigning clear ownership and tracking its performance metrics [52].
2. Our automated tests frequently break due to minor application changes, creating a execution bottleneck. How can we make our tests more resilient? Brittle tests that require frequent maintenance are a major bottleneck and can quickly erode ROI [52] [53]. To address this, focus on creating reliable abstraction layers for UI elements and implement robust test data management [52]. Additionally, consider leveraging modern test management platforms that offer native integrations with bug-tracking systems. This can streamline defect resolution and reduce communication delays between testers and developers [54].
3. We struggle with visibility into test progress and results. How can we improve reporting and collaboration? A lack of visibility is a common bottleneck that slows down the entire testing process [53]. Implementing a dedicated test management platform can provide real-time dashboards and automated reports [54] [53]. These tools centralize test cases, results, and defect tracking, giving developers, testers, and stakeholders immediate access to the same information and reducing the time spent on manual status updates [54].
4. How do we justify the initial investment in test automation to leadership? Frame your business case in terms of measurable outcomes that align with company goals [52]. Instead of focusing on technical details, highlight how automation leads to faster release cycles without increasing headcount, a decrease in defect leakage to production, and more predictable delivery timelines [52]. Use conservative ROI calculations that account for both upfront costs and long-term savings from regained engineering capacity [52].
Troubleshooting Guides
Problem: Declining Test Automation ROI
A declining ROI often signals that the costs of maintaining your automation suite are outweighing the benefits.
Step 1: Diagnose the Cause
- Check if you are underestimating maintenance costs for script updates [52].
- Determine if tests are being run frequently enough to justify their creation; ROI is higher in environments with frequent releases [52].
- Evaluate if the application has low stability, leading to constant test failures from UI/API changes [52].
- Verify if the team has the necessary skills to build and maintain automation efficiently [52].
Step 2: Apply Corrective Measures
- Prioritize High-Value Tests: Concentrate automation efforts on critical business paths (e.g., user login, checkout flows) rather than edge cases [52]. The table below summarizes key ROI drivers and their impact.
- Reduce Maintenance: Invest in good test design practices, such as the Page Object Model, to create abstraction layers that make tests less brittle to front-end changes [52].
- Track the Right Metrics: Monitor metrics like test execution time per release, reduction in manual testing hours, and the number of production hotfixes to demonstrate value [52].
Step 3: Implement Preventive Best Practices
- Establish a clear automation ownership model within the team [52].
- Integrate automation tasks into your regular sprint planning to ensure ongoing maintenance and development [52].
- Develop a Total Cost of Ownership (TCO) model that includes tooling, infrastructure, labor, and training to set realistic ROI expectations [52].
Table 1: Key Factors Influencing Test Automation ROI
| Factor | Impact on ROI | Recommended Action |
|---|---|---|
| Release Frequency [52] | Higher frequency increases ROI by reusing tests more often. | Integrate automated tests into your CI/CD pipeline. |
| Application Stability [52] | Low stability decreases ROI due to high test maintenance. | Automate stable modules first; use risk-based testing for volatile areas. |
| Test Coverage Strategy [52] | Automating high-value, repeatable scenarios offers the strongest ROI. | Focus on critical regression, smoke, and integration tests. |
| Team Skill & Ownership [52] | Lack of expertise and ownership leads to test suite degradation. | Assign clear ownership and provide upskilling opportunities. |
Problem: Automated Test Execution Bottlenecks
Execution bottlenecks prevent your team from getting fast feedback, slowing down the entire development cycle.
Step 1: Identify the Bottleneck
- Slow Test Execution: Test suites take hours to complete, delaying builds.
- Flaky Tests: A significant number of tests produce inconsistent pass/fail results, requiring manual investigation and eroding trust in the automation suite.
- Environment Inavailability: Tests cannot run because test environments are unstable, inconsistently configured, or occupied by other teams.
- Poor Visibility and Collaboration: Scattered test results and poor communication tools slow down defect resolution and decision-making [53].
Step 2: Apply Corrective Measures
- For Slow Execution: Parallelize test execution across multiple machines or containers. Introduce test prioritization, running critical smoke tests before full regression suites.
- For Flaky Tests: Establish a "flaky test" quarantine process. Immediately investigate and fix or remove non-deterministic tests to maintain suite reliability.
- For Environment Issues: Advocate for the use of containerized, on-demand test environments that can be spun up quickly and torn down after execution.
Step 3: Implement Systemic Solutions
- Adopt a Test Management Platform: A centralized platform reduces bottlenecks by improving traceability and collaboration. It provides a single source of truth for test cases, bugs, and executions, connecting various tools used by the team [54] [53].
- Foster a "Quality is Everyone's Job" Culture: Involve developers in testing efforts through practices like unit testing and code review. This helps catch bugs earlier and reduces the burden on dedicated QA further down the pipeline [53].
The following workflow diagram illustrates a robust process for maintaining ROI and managing bottlenecks.
Diagram 1: A workflow for diagnosing and resolving common test automation challenges.
The Researcher's Toolkit: Essential Solutions for Automated Testing
Table 2: Key Research Reagent Solutions for Test Automation
| Item / Solution | Function & Explanation |
|---|---|
| Test Management Platform [54] [53] | Centralizes requirements, test cases, and defect tracking. It enhances visibility with real-time dashboards and improves collaboration between testers and developers, directly addressing communication bottlenecks. |
| CI/CD Integration [52] | The pipeline (e.g., Jenkins, GitLab CI) where automated tests are embedded to enable continuous execution. This surfaces bugs earlier in the development cycle when they are cheaper to fix, significantly improving ROI. |
| Modular Test Design [52] | A design pattern for creating automated tests that emphasizes reusability and separation of concerns. It reduces long-term maintenance costs by making test scripts less brittle and easier to update when the application changes. |
| Test Automation Framework [52] | A set of guidelines, coding standards, and tools that provide a foundation for creating and executing automated tests. It standardizes efforts, lowers the skill barrier for team members, and is crucial for long-term scalability and maintainability. |
Experimental Protocol: Calculating Test Automation ROI
Objective: To quantitatively measure the Return on Investment (ROI) of a test automation suite over a defined period (e.g., one year) to justify current investment or guide future strategy [52].
Methodology:
Define Investment Costs: Calculate the total investment, which includes:
- Tooling: Cost of automation software licenses and infrastructure.
- Labor: Time spent by engineers building and maintaining automation scripts.
- Training: Cost of upskilling team members.
- Integration: Effort required to integrate automation into the development pipeline [52].
Quantify Value Gained: Measure the following outcomes:
- Time Saved: Calculate the reduction in manual testing hours. For example: (Time saved per regression cycle) × (Number of releases per year) × (Daily cost of a QA engineer) [52].
- Defect Cost Avoided: Estimate the cost saved by preventing major bugs from reaching production. This includes support, rework, and reputational damage costs [52].
- Other Benefits: Quantify other gains, such as increased release frequency or reduced hotfixes.
Calculate ROI: Use the standard formula to compute the return [52] [55]:
- ROI = (Total Value Gained – Total Investment) / Total Investment
Workflow: The following diagram outlines the protocol for this ROI calculation experiment.
Diagram 2: A protocol for experimentally calculating Test Automation ROI.
Strategies for Ensuring Data Reliance and Integrity Across Cycles
Frequently Asked Questions (FAQs)
FAQ 1: What are the most common data integrity issues in research cycles? The most common data integrity issues encountered in research and development cycles include incomplete data (missing or incomplete information), inaccurate data (errors and discrepancies), duplicate data (multiple entries for the same entity), inconsistent data (conflicting values across different systems), and outdated data (information that is no longer current or relevant) [56]. These issues can disrupt operations, compromise decision-making, and erode trust in research outcomes [56].
FAQ 2: How can we ensure data quality when integrating information from multiple sources or CROs? Ensuring data quality with multiple sources, like Contract Research Organizations (CROs), requires a strategy centered on complete and continuous data transparency [57]. Prioritize partners who offer this, allowing for immediate insight derivation. Establish shared systems to enable fluid data exchange for critical tasks like protocol design and participant identification [57]. This approach, grounded in end-to-end data ownership, improves oversight and fosters more nimble, trustworthy collaboration [57].
FAQ 3: What role does automation play in maintaining data integrity? Automation is critical for maintaining data integrity at scale, particularly in handling growing data volumes with limited resources [57]. It enables real-time validation, automated anomaly detection, and continuous pipeline monitoring [56] [58]. However, automation's effectiveness depends on a foundation of reliable, consistent, and well-connected data. Strengthening this foundation with standardized, end-to-end processes is a prerequisite for successful automation and AI innovation [57].
FAQ 4: How can we fix fragmented data across different systems? The primary solution for fragmented data is to centralize it into a unified cloud data warehouse [59]. This eliminates reliance on error-prone manual processes like spreadsheet exports and provides teams with a single, reliable source of truth. Utilizing automated data integration platforms with built-in checks can dramatically reduce the time spent on manual error-checking and provide greater operational visibility [59].
Troubleshooting Guides
Issue 1: High Rate of Data Entry Errors and Inconsistencies
Problem: Manual data entry is leading to inaccuracies, typos, and inconsistent formatting, which compromises data reliability.
Solution:
- Implement Input Validation: Enforce strict, rule-based checks at the point of data entry. This includes format validation (e.g., email structure), range validation (e.g., acceptable value ranges), and presence validation (e.g., required fields) [56].
- Establish Data Standards: Define and enforce clear standards for how data should be structured, formatted, and labeled across all systems. This creates a "single source of truth" [56].
- Utilize Automated Data Cleansing Tools: Use tools that can automatically identify and rectify common errors like misspelled names or inconsistent formats [56].
Issue 2: Proliferation of Duplicate Data Records
Problem: Multiple records for the same entity (e.g., patient, compound) are causing skewed reporting and analysis.
Solution:
- De-duplication Processes: Implement processes that use fuzzy matching or rule-based matching to identify and merge duplicate records. This is especially critical for customer, product, and transaction data [56].
- Leverage Unique Identifiers: Use unique identifiers (e.g., patient IDs, compound IDs) to prevent the creation of new duplicates by ensuring every data entry is distinct [56] [59].
- Schema-aware Updates: Employ data pipeline tools that use incremental syncs and primary keys to only bring in new or changed records, updating existing ones instead of creating duplicates [59].
Issue 3: Data Becomes Quickly Outdated
Problem: Information in downstream analytics tools does not reflect changes in source systems, leading to decisions based on stale data.
Solution:
- Implement Change Data Capture (CDC): Use CDC technology to track every addition, revision, and deletion in source systems and automatically apply them to the destination database [59].
- Schedule Regular Data Audits: Perform routine checks to detect stale, incomplete, or incorrect data. Establish data aging policies to define when information should be updated or archived [56].
- Monitor Pipeline Health: Continuously monitor the status of data pipelines to catch sync failures or delays that could result in outdated data, setting up real-time alerts for issues [58].
Data Integrity Tools Comparison
The following table summarizes key tools available in 2025 to help maintain data integrity across research cycles.
| Tool Name | Best For | Key Features | Starting Price |
|---|---|---|---|
| Hevo Data [58] | Multi-source ETL/ELT | No-code platform; 150+ connectors; Real-time error logs & replay; Data deduplication. | $239/month |
| Monte Carlo [58] | Enterprise observability | Automated anomaly detection; End-to-end lineage mapping; Incident management with root cause analysis. | Custom Pricing |
| Great Expectations [58] | Open-source Python pipelines | Open-source validation framework; 50+ built-in data checks; Integration with orchestration tools (e.g., Airflow). | Free / Custom (GX Cloud) |
| Soda Data Quality [58] | Data validation at scale | SQL & YAML-based testing; Data profiling; Tracks quality thresholds & agreements. | $8/month per dataset |
| Informatica IDMC [58] | Large enterprise data | AI-powered quality rules; Multi-domain master data management; Integrated governance & validation. | Custom Pricing |
Experimental Protocols for Data Integrity
Protocol 1: Implementing a Data Validation Framework
Objective: To embed automated data quality checks into the research data pipeline. Methodology:
- Define Expectations: Use a framework like Great Expectations to create "Expectation Suites"—declarative, testable statements about your data (e.g., "column
patient_agemust not be null," "columnassay_valuemust be between 0 and 100") [58]. - Integrate with Orchestration: Incorporate these validation suites into your data pipeline orchestration tool (e.g., Airflow, Prefect). Configure the pipeline to run the validations after key data ingestion or transformation steps [58].
- Handle Results: Set up alerts to notify data stewards immediately when a validation check fails. The pipeline can be configured to halt or branch based on the validation results, preventing bad data from propagating [58].
Protocol 2: Establishing a Risk-Based Data Quality Monitoring System
Objective: To proactively identify and resolve data integrity issues before they impact research outcomes. Methodology:
- Profile Data: Use automated profiling tools to scan datasets and suggest relevant quality checks based on discovered patterns and anomalies [58].
- Set Thresholds: Define Data Quality Service Level Agreements (SLAs) or thresholds for key metrics like freshness, volume, and schema consistency [58].
- Automate Anomaly Detection: Implement machine learning-based monitoring (e.g., with a tool like Monte Carlo) that learns normal data patterns and triggers alerts when unusual deviations occur, enabling rapid root cause analysis [58].
DBTL Data Integrity Workflow
The following diagram illustrates a robust data integrity workflow integrated within an automated Design-Build-Test-Learn (DBTL) cycle, ensuring data reliance at every stage.
Research Reagent Solutions
| Reagent / Solution | Function |
|---|---|
| Data Validation Framework (e.g., Great Expectations) [58] | Provides a library of pre-defined and custom "expectations" to formally document and test assumptions about data, transforming implicit knowledge into executable checks. |
| Data Observability Platform (e.g., Monte Carlo) [58] | Uses machine learning to automatically monitor data health across the entire ecosystem, detecting anomalies in freshness, volume, and schema without manual rule configuration. |
| Automated Data Pipeline Tool (e.g., Hevo Data, Fivetran) [58] [59] | Moves data from disparate sources to a central warehouse with built-in integrity features like change data capture (CDC), deduplication, and self-healing syncs to prevent data loss. |
| Master Data Management (MDM) Platform [58] | Creates and manages a single, authoritative source for critical data entities (e.g., patients, compounds), ensuring consistency and accuracy across all research systems. |
| Data Catalog with Governance [56] | Documents data assets, their definitions, lineage, and ownership, providing the metadata context necessary to validate, trace, and build trust in research data. |
Overcoming Poor Team Collaboration Between Dry and Wet Labs
Frequently Asked Questions (FAQs)
1. What is the most common source of friction in wet-dry lab collaborations? The most common source of friction is misaligned expectations and research values that are not clearly expressed or negotiated. This includes different definitions of success, timelines, and communication styles between computational and experimental researchers [60].
2. How can we ensure our collaborative data is usable for both teams? Adopt the FAIR (Findable, Accessible, Interoperable, Reusable) data principles. Establish clear, systematic standards for metadata format and style that are easily accessible to experimentalists and easily parsed by analysts. For sensitive data, a formal data sharing agreement is essential [60].
3. What should we discuss about publications at the start of a project? Explicitly discuss and agree upon strategies for paper publishing, target journals, preprints, author ordering, and corresponding authorship. Embrace author contribution taxonomies like CRediT to ensure fair and transparent attribution [60].
4. Our DBTL cycles are slow. How can automation help? Automation addresses key bottlenecks: software-assisted Design reduces manual errors in genetic design; robotic liquid handlers in the Build phase enhance precision; high-throughput screening in the Test phase accelerates analysis; and machine learning in the Learn phase uncovers patterns in large datasets to inform the next cycle [61]. Integrated platforms can orchestrate this entire workflow [62] [61].
5. How can machine learning improve our iterative DBTL cycles? Machine learning, particularly in the "Learn" phase, can analyze complex experimental data to make accurate genotype-to-phenotype predictions. For example, Bayesian optimization and models like gradient boosting can guide metabolic engineering by learning from data to recommend new strain designs for the next DBTL cycle, dramatically reducing the number of experiments needed [63] [15] [61].
Troubleshooting Guides
Problem: Incompatible Data Formats and Metadata
Symptoms: Delays in data analysis, errors when parsing data, inconsistent results. Solution:
- Pre-Project Alignment: Before experiments begin, both teams should agree on data and metadata structures, file naming policies, and formats [60].
- Utilize Standards: Leverage existing synthetic biology data standards (e.g., SBOL - Synthetic Biology Open Language) for genetic design information to ensure interoperability [62] [19].
- Centralize Data: Implement a unified software platform (e.g., a LIMS - Laboratory Information Management System) that acts as a central hub for all experimental data, connecting instrument outputs with the design-build process [64] [61].
Problem: Disconnected Experimental Design and Analysis
Symptoms: Experiments lack proper controls for computational analysis, computational models are not validated with real-world data. Solution:
- Joint Experimental Design: Involve dry lab members in the design phase to ensure the experimental plan will generate data suitable for computational analysis and model validation [60].
- Define the Analysis Plan Early: Agree on a rough analysis plan and the minimal desired outcomes (e.g., initial data analysis, final figures) during the experimental design stage [60].
- Establish a Closed-Loop DBTL: Use a software architecture where the "Learn" phase directly informs the next "Design" phase. This can be implemented using workflow orchestrators (e.g., Airflow) and structured data flow [62] [63].
Problem: Inefficient and Error-Prone Manual Workflows
Symptoms: Low throughput in the Build and Test phases, human error in repetitive tasks, difficulty replicating results. Solution:
- Automate Repetitive Tasks: Integrate automated liquid handling robots (e.g., from Tecan or Beckman Coulter) for the Build phase and high-throughput plate readers for the Test phase [61].
- Use Platform-Agnostic Languages: Adopt languages like PyLabRobot or LabOP to create protocols that can be transferred across different robotic hardware, increasing flexibility and reducing vendor lock-in [62].
- Digital Protocol Generation: Use software to automatically generate detailed, error-checked assembly protocols for genetic constructs, considering factors like restriction enzyme sites and GC content [61].
Experimental Protocols for Enhanced Collaboration
Protocol 1: Establishing a Shared Data Framework
Objective: To create a standardized data and metadata structure for a joint project. Methodology:
- Kick-off Meeting: Hold a meeting with members from both wet and dry labs.
- Define Data Types: List all expected data types (e.g., NGS sequences, plate reader measurements, proteomics data).
- Select Formats: Agree on open, non-proprietary file formats (e.g., CSV, JSON) for each data type.
- Create Metadata Template: Collaboratively develop a spreadsheet template for metadata that must accompany all experimental data. This should include fields like
researcher_id,date,experiment_type,strain_id,protocol_version, andinstrument_id. - Documentation: Document the agreed standards in a shared project repository.
Protocol 2: Implementing a Basic Automated DBTL Cycle
Objective: To execute a single, automated Design-Build-Test-Learn cycle for optimizing a metabolic pathway. Methodology:
- Design: Use a software platform (e.g., TeselaGen) to design a library of genetic variants. The output is a digital file (e.g., in SBOL format) defining the constructs [61] [65].
- Build:
- The software generates assembly instructions and integrates with an automated liquid handler.
- The robot executes the protocol to build the DNA constructs [61].
- Test:
- Learn:
Workflow Visualization
Diagram 1: Ideal Collaborative DBTL Workflow
Diagram 2: Data and Tool Exchange in Collaboration
Research Reagent and Solution Tools
Table 1: Key Reagents and Platforms for Automated Collaborative Workflows
| Item Name | Type | Primary Function in Collaboration |
|---|---|---|
| SBOL (Synthetic Biology Open Language) [62] [65] | Data Standard | Provides a standardized digital format for representing genetic designs, ensuring wet and dry lab teams are working from the same blueprint. |
| Automated Liquid Handlers (e.g., Tecan, Beckman Coulter) [61] | Hardware | Executes precise, high-throughput pipetting protocols for the "Build" phase, reducing human error and increasing reproducibility. |
| Laboratory Information Management System (LIMS) [61] | Software | Acts as a centralized hub for all project data, connecting instrument outputs, sample metadata, and analysis results for full traceability. |
| PyLabRobot / LabOP [62] | Software Language | Platform-agnostic programming languages for writing liquid-handling protocols, making automation methods transferable between different labs and hardware. |
| Twist Bioscience / IDT Integration [61] | Service/Platform | Streamlines the process of ordering custom DNA sequences and integrating them directly into the digital design and automated build workflow. |
| Bayesian Optimization Algorithms [63] [15] | Computational Tool | A machine learning method used in the "Learn" phase to efficiently guide experimental design by modeling complex genotype-phenotype landscapes. |
Comparison of Collaborative Platforms and Strategies
Table 2: Quantitative Comparison of DBTL Cycle Strategies and Tools
| Strategy / Tool | Key Collaborative Benefit | Reported Efficiency Gain | Considerations |
|---|---|---|---|
| Fully Automated DBTL (BioAutomata) [63] | Closes the DBTL loop with minimal human intervention, integrating AI-driven experiment selection with robotic execution. | Evaluated <1% of possible variants while outperforming random screening by 77%. | High initial setup cost and complexity. Ideal for well-defined optimization problems. |
| Cloud-Based Platform (e.g., TeselaGen) [61] | Enables real-time collaboration for geographically dispersed teams with easy access to data and tools. | Scalable, pay-as-you-go model reduces upfront costs. Facilitates advanced analytics. | Potential long-term cost for data-intensive projects; specific regulatory compliance may be a concern. |
| On-Premises Platform [61] | Offers direct control over data and IT infrastructure, which is essential for specific security and regulatory requirements. | Can be cost-effective for large-scale, consistent workloads without recurring subscription fees. | Higher upfront investment; scalability and collaboration for non-co-located teams can be challenging. |
| Joint Experimental Design [60] | Prevents mismatched expectations and ensures experiments generate data suitable for computational analysis. | Mitigates the need for costly experiment repetition. A foundational practice with immeasurable long-term benefits. | Requires time investment for upfront meetings and alignment. |
| Simulated DBTL Framework [15] | Provides a risk-free environment to test and optimize machine learning strategies and collaboration workflows before wet-lab experimentation. | Helps prioritize the most effective ML methods (e.g., gradient boosting in low-data regimes) and cycle strategies. | Relies on the accuracy of the underlying kinetic model. |
Managing the Complexity of Hyper-Automation and Distributed Systems
Technical Support Center: Troubleshooting Guides and FAQs
This technical support resource addresses common challenges researchers face when implementing automated Design-Build-Test-Learn (DBTL) cycles within hyper-automated, distributed systems for metabolic engineering and drug development.
Frequently Asked Questions (FAQs)
Q1: Our automated DBTL pipeline is producing high variation in screening results, making it difficult to learn and recommend the next cycle's designs. What could be the cause? Inconsistent results often stem from biases in your initial training data or experimental noise. In simulated DBTL frameworks, gradient boosting and random forest machine learning models have demonstrated robustness against these issues, especially in the low-data regimes typical of early-cycle research [15]. Ensure your initial DNA library design covers a representative range of the combinatorial space to avoid introducing systematic bias from the start [15].
Q2: When building a combinatorial DNA library for a new pathway, how should we allocate our resources across multiple DBTL cycles for maximum efficiency? The strategy for distributing resources across cycles is critical. Simulation studies indicate that when the total number of strains you can build is constrained, a strategy that starts with a larger initial DBTL cycle is more favorable than distributing the same number of strains equally across every cycle [15]. This initial larger investment in data generation provides a stronger foundation for machine learning models to learn from in subsequent, smaller cycles.
Q3: In a hyper-automation context, how can we effectively integrate robotic process automation (RPA) with other AI technologies? RPA has evolved beyond rule-based tasks. When integrated with AI and machine learning, it becomes adaptable and intelligent. By 2025, RPA is expected to be augmented with AI that can learn and improve over time, creating autonomous workflows that adjust using real-time data [66]. For a DBTL pipeline, this means RPA bots can handle data logging and system orchestration, while AI components manage complex decision-making like design recommendations.
Q4: What is the role of a digital twin in optimizing a hyper-automated DBTL pipeline? A digital twin—a virtual copy of a physical system—allows you to simulate and test automation strategies before real-world implementation. In business and manufacturing contexts, digital twins are used to model business processes, test automation techniques, and forecast outcomes in a risk-free, controlled environment [66]. For your research, you could create a digital twin of your entire DBTL pipeline to simulate the impact of new equipment, different scheduling algorithms, or modified experimental protocols.
Q5: How can we ensure data security and compliance when automating processes that handle sensitive experimental data? Hyper-automation introduces new data volumes and flows that must be secured. It is critical to "stack security protocols into your automation strategy" from the outset [66]. Automation can itself be leveraged to enhance security by performing regular, system-wide audits and scanning for sensitive data types (e.g., Protected Health Information) to ensure compliance with regulations like HIPAA within automated workflows [67].
Troubleshooting Common Technical Issues
Issue: Failure in Automated Pathway Assembly
- Problem: The ligase cycling reaction (LCR) or other automated assembly method on a robotics platform is failing, resulting in low yield of correct constructs.
- Methodology:
- Verify Input Materials: Confirm the concentration and purity of DNA parts post-PCR using capillary electrophoresis. Impure or degraded parts are a common point of failure.
- Check Assembly Recipes: Review the automated worklists generated by design software (e.g., PlasmidGenie) for any errors in reagent volumes or sequences [42].
- Quality Control (QC): Implement a high-throughput QC pipeline. This should include automated plasmid purification, restriction digest, and analysis by capillary electrophoresis, followed by sequence verification of candidate clones [42].
- Solution: The modular nature of automated DBTL pipelines allows you to troubleshoot the "Build" stage independently. Re-run the PCR clean-up step, which is often a manual bottleneck, and ensure seamless transfer of plates between robotic platforms.
Issue: Machine Learning Recommendations Failing to Improve Production Titer
- Problem: After multiple DBTL cycles, the machine learning model's recommendations are not leading to a significant increase in the product of interest.
- Methodology:
- Interrogate the Training Data: Analyze the data from your "Test" phase. Is it high-quality and consistent? Use the automated extraction and mass spectrometry data processing scripts to re-calibrate and ensure data uniformity [42].
- Check for Overfitting: The model may be overfitting to noisy data or a biased initial library. Use the framework from simulated kinetic models to test your machine learning method's performance [15].
- Re-evaluate Design Factors: In one documented case, statistical analysis revealed that vector copy number and the promoter strength of a specific enzyme (CHI) had the strongest significant effects on production, while gene order did not [42]. Re-run your statistical analysis to confirm you are optimizing the correct parameters.
- Solution: Incorporate a "robustness check" in your Learn phase. Test the model's predictions against a small, random set of designs from the library to see if it can generalize. If not, consider switching to a more robust algorithm like gradient boosting or expanding the design space explored in the next cycle.
Issue: Integration Failure Between Distributed Systems
- Problem: The data from the automated mass spectrometer (Test) is not being correctly ingested by the machine learning model for the Learn phase, due to interoperability issues between different instruments and software.
- Methodology:
- Audit Data Handoffs: Map the entire data flow from instrument to database. Identify all points of translation between file formats and data structures.
- Implement a Unified Tracking System: Use a centralized data repository like JBEI-ICE [42] to assign unique IDs to all samples, designs, and data outputs. This ensures traceability across distributed modules.
- Leverage End-to-End Process Orchestration: Hyper-automation trends for 2025 emphasize moving beyond stitched-together tools to orchestrating seamless, start-to-finish workflows [68]. Apply this principle by using a master orchestration tool to manage handoffs between the Build, Test, and Learn distributed systems.
- Solution: Develop and enforce standard operating procedures (SOPs) and data schemas for all systems. Middleware or custom scripts can be used to normalize data outputs into a single, predictable format for the Learn phase, ensuring a continuous and error-free DBTL cycle.
Table 1: Key Performance Indicators from an Automated DBTL Pipeline for Flavonoid Production [42]
| DBTL Cycle | Number of Constructs Built | Pinocembrin Titer Range (mg L⁻¹) | Key Learning |
|---|---|---|---|
| Cycle 1 | 16 (from 2592 designs) | 0.002 – 0.14 | Vector copy number and CHI promoter strength had the strongest positive effect on production. |
| Cycle 2 | Not Specified | Up to 88 | Applying learnings from Cycle 1 (e.g., using high-copy-number vector) led to a ~500-fold improvement. |
Table 2: Machine Learning Model Performance in Simulated DBTL Cycles [15]
| Model / Factor | Performance in Low-Data Regime | Robustness to Training Set Bias | Robustness to Experimental Noise |
|---|---|---|---|
| Gradient Boosting | High | High | High |
| Random Forest | High | High | High |
| Other Tested Methods | Lower | Lower | Lower |
Experimental Protocols
Protocol 1: High-Throughput Screening for Metabolite Production This methodology is derived from an automated pipeline for flavonoid production [42].
- Culture & Induction: Inoculate 96-deepwell plates with E. coli production chassis containing pathway constructs. Use automated liquid handlers for consistency. Grow cultures to a specified OD and induce with the appropriate agent.
- Metabolite Extraction: After a defined production period, use an automated platform to extract metabolites from the culture broth.
- Analysis: Employ fast ultra-performance liquid chromatography (UPLC) coupled to tandem mass spectrometry (MS/MS) with high mass resolution for separation and quantification.
- Data Processing: Use custom-developed, open-source R scripts for automated data extraction, peak integration, and concentration calculation based on standard curves.
Protocol 2: Simulated DBTL Cycle for Machine Learning Benchmarking This protocol uses a kinetic model-based framework to test ML algorithms without costly lab experiments [15].
- Model Representation: Use a mechanistic kinetic model (e.g., implemented in the SKiMpy package) to represent a metabolic pathway embedded in a physiologically relevant cell model, such as an E. coli core kinetic model.
- In silico Perturbation: Simulate combinatorial libraries by changing the
Vmaxparameters in the model, which correspond to variations in enzyme levels achieved through a DNA library (e.g., promoters, RBS). - Data Generation: For each in silico strain design, run the kinetic model to simulate a batch bioprocess and record the product flux (titer/yield/rate).
- ML Training & Validation: Use the simulated dataset (enzyme levels -> product titer) to train and validate different machine learning models. Test their performance over multiple simulated DBTL cycles and under various conditions of noise and bias.
Workflow and System Diagrams
The Scientist's Toolkit: Research Reagent Solutions
Table 3: Essential Materials for an Automated DBTL Pipeline [42]
| Item / Reagent | Function in the Pipeline |
|---|---|
| Ligase Cycling Reaction (LCR) Reagents | Enables robust, automated assembly of multiple DNA parts into pathway constructs on a robotics platform. |
| JBEI-ICE Repository | A centralized registry for tracking all DNA part designs, plasmid assemblies, and associated metadata, ensuring data consistency and reproducibility. |
| Design of Experiments (DoE) Software | Statistically reduces large combinatorial libraries into a tractable number of representative constructs for laboratory testing, maximizing information gain from minimal experiments. |
| Custom R Scripts for UPLC-MS/MS | Automates the extraction, processing, and quantification of raw chromatographic data, standardizing the "Test" phase and feeding clean data to the "Learn" phase. |
| Mechanistic Kinetic Models (e.g., SKiMpy) | Provides a simulated framework for benchmarking machine learning algorithms and DBTL strategies before committing to costly wet-lab experiments [15]. |
Implementing DataOps for Continuous Integration and Improved Data Quality
Technical Support Center: FAQs & Troubleshooting Guides
Frequently Asked Questions (FAQs)
Q1: What is DataOps and how does it relate to our automated DBTL cycles in synthetic biology?
DataOps (Data Operations) is a methodology that applies agile development, DevOps principles, and automation to data management [69] [70]. It aims to improve the speed, quality, and reliability of data workflows. For automated Design-Build-Test-Learn (DBTL) cycles, DataOps ensures that the vast amounts of data generated from high-throughput testing—such as metabolomics or proteomics data—are integrated, validated, and made reliable for the subsequent "Learn" phase, creating a faster and more reliable research feedback loop [41].
Q2: How can DataOps practices specifically accelerate our DBTL research?
DataOps directly addresses key bottlenecks in DBTL cycles. The "Test" phase often remains a throughput bottleneck, generating complex, multi-omics data [41]. DataOps introduces automated data validation and continuous integration, which improves data quality and reduces the time from experiment to actionable insight [69] [71]. This means your team can learn from experiments more quickly and initiate the next design cycle with higher-quality data, effectively increasing the iteration speed of your DBTL pipelines [69].
Q3: What are the first steps to implementing DataOps in a research environment?
A successful implementation involves several key steps [69] [71]:
- Assess your data landscape: Identify all data sources, from sequencing machines to analytical instruments.
- Build cross-functional teams: Foster collaboration between data engineers, scientists, and bioinformaticians.
- Select the right tools: Choose technologies for data orchestration (e.g., Apache Airflow), version control (e.g., Git), and monitoring.
- Establish clear processes: Define standardized protocols for data intake, processing, and quality checks.
- Automate repetitive tasks: Implement automation for data ingestion and transformation to minimize manual errors.
Q4: What tools are commonly used to build a DataOps pipeline?
The table below summarizes key categories of tools essential for a DataOps framework:
Table: Key DataOps Tool Categories for Research Environments
| Tool Category | Purpose | Example Tools |
|---|---|---|
| Data Orchestration | Manages and automates complex data workflows. | Apache Airflow, Prefect, Kubernetes [69] |
| CI/CD & Version Control | Automates testing/deployment of data pipelines and tracks changes. | Jenkins, Git [69] |
| Data Monitoring & Observability | Provides real-time insight into pipeline health and data quality. | Grafana, Datadog, Acceldata [69] |
| Data Integration | Facilitates data flow from disparate sources (e.g., lab instruments). | Apache NiFi, Talend [69] |
Troubleshooting Guides
Issue 1: Pipeline State Sync or Desynchronization Errors
- Problem: A loss of synchronization between your pipeline's configuration and its target state, often occurring in development environments with frequent changes [72].
- Symptoms: Pipeline failures, inconsistent data results, or errors stating that the current state does not match the expected configuration.
- Solution: Perform a State Reset.
- This is a common remediation step in automated pipelines that use infrastructure-as-code tools like Terraform [72].
- Run your pipeline with the variable
LIFECYCLE_STATE_RESETset to1. This instructs the system to drop the internal state file and rebuild it from a fresh scan of the current environment [72]. - Note: Always ensure you have a recent backup before performing a state reset.
Issue 2: General Pipeline Errors with Unclear Causes
- Problem: A data pipeline fails, but the error logs do not provide sufficient detail to diagnose the root cause.
- Symptoms: Generic failure messages, unclear which component of the pipeline is failing.
- Solution: Enable Debug Mode.
- Rerun the failed pipeline with the environment variable
DATAOPS_DEBUGset to1[72]. - This action will output additional, detailed debug information into the job logs. For security, the system will automatically mask secret values in these logs [72].
- Use the enriched log output to pinpoint the exact stage and nature of the failure.
- Rerun the failed pipeline with the environment variable
Issue 3: Poor Data Quality Undermining the "Learn" Phase
- Problem: The data reaching the "Learn" phase of the DBTL cycle is inaccurate, incomplete, or inconsistent, leading to unreliable insights for the next design iteration.
- Symptoms: Inability to reproduce results, statistical anomalies, and failed experimental validation.
- Solution: Implement Automated Data Quality Checks.
- Methodology: Integrate automated validation checks directly into your data pipelines. This is a core DataOps practice [69] [73].
- Protocol:
- Define Metrics: Establish clear, quantifiable data quality metrics (e.g., allowable value ranges for pH or temperature, data completeness percentages, format consistency for gene identifiers).
- Integrate Checks: Use tools like DBT (data build tool) or custom scripts to run checks at key stages of the data pipeline—right after ingestion, after transformation, and before loading into the target analysis database [69].
- Automate Alerting: Configure the pipeline to automatically halt and send alerts to the research and data teams when a quality check fails, preventing corrupt data from propagating.
- Document & Iterate: Maintain a data quality log to track recurring issues and refine your validation rules over time [73].
Visualizing the Integrated DataOps and DBTL Workflow
The following diagram illustrates how DataOps practices are integrated into an automated DBTL cycle to enhance data flow and reliability.
DataOps-Enhanced DBTL Cycle
The Scientist's Toolkit: Research Reagent & Solution Tables
DataOps "Reagents" for DBTL Pipelines
The following table details key technological solutions and their functions in a DataOps-enabled research environment.
Table: Essential DataOps Tools and Their Functions in Research
| Tool / Solution | Function in the Data Pipeline |
|---|---|
| Apache Airflow | An orchestration tool used to author, schedule, and monitor complex computational workflows, such as a multi-step omics data analysis pipeline [69]. |
| Jenkins | An automation server that facilitates Continuous Integration and Continuous Deployment (CI/CD) by automating the build, test, and deployment stages of data pipeline code [69]. |
| Git | A version control system that tracks all changes made to data pipeline scripts, configuration files, and data models, enabling collaboration and allowing rollbacks if needed [69] [74]. |
| Grafana | A monitoring and observability platform used to build real-time dashboards that visualize data pipeline performance, data freshness, and error rates [69]. |
| Apache NiFi | An automated data integration tool that facilitates the flow of data from various sources (e.g., HPLC machines, sequencers) into a centralized data lake or processing environment [69]. |
| DBT (Data Build Tool) | A transformation tool that enables analysts and engineers to transform, test, and document data in the warehouse using SQL, crucial for preparing raw experimental data for analysis [69]. |
Quantitative Benefits of DataOps Implementation
The adoption of a DataOps framework yields measurable improvements in data efficiency and operational performance, as summarized in the table below.
Table: Measured Benefits of DataOps Adoption
| Metric of Improvement | Quantitative Impact | Context/Source |
|---|---|---|
| Data Analytics Efficiency | 20% to 40% increase | Organizations adopting DataOps experience significant gains in how efficiently their data analytics processes function [69]. |
| Data Delivery Speed | Dramatic reduction in time-to-insight | Automation and streamlined processes enable teams to process and analyze data more quickly, leading to faster insights [71]. |
| Operational Efficiency | Increased productivity and cost reduction | Automation reduces manual workloads and errors, allowing teams to focus on higher-value analysis and strategy [69] [70]. |
Ensuring Rigorous Validation, Regulatory Compliance, and Benchmarking
Validating AI/ML Model Outputs in a Regulatory Context
Troubleshooting Guide & FAQs
This guide addresses common challenges researchers face when validating AI/ML outputs for regulatory submissions in automated DBTL (Design, Build, Test, Learn) cycles. The following FAQs target specific technical and compliance issues encountered during development.
FAQ: Addressing Common Validation Challenges
1. Our model performs well during internal validation but fails with external data. What is the likely cause and how can we troubleshoot this?
This typically indicates overfitting or a mismatch between your validation data and real-world conditions [27]. To troubleshoot:
- Re-evaluate your validation set design: An "easy test set" can inflate performance metrics. Curate your validation data to include problems of various difficulty levels, mirroring the challenge distribution expected in production [75].
- Stratify performance reporting: Don't just report aggregate metrics. Analyze and report model performance separately for easy, moderate, and hard problem categories to identify performance gaps on challenging cases [75].
- Conduct thorough feature analysis: Use explainability tools like LIME or SHAP to ensure your model is relying on biologically relevant features rather than spurious correlations in your training set [76].
2. What are the FDA's key expectations for AI model transparency and explainability in a regulatory submission?
The FDA's 2025 draft guidance emphasizes that models must be transparent and explainable, especially when they influence regulatory decisions [77] [78]. Your team must be prepared to document and explain:
- The data used to train the model and its key characteristics [77] [78].
- The model's decision logic to the extent possible [77].
- Performance across appropriate subgroups to demonstrate a lack of harmful bias [78] [79].
- The model's operational context (Context of Use) and how its performance supports that specific use [78].
3. We are using a pre-trained or vendor-supplied AI model in our pipeline. What are our compliance responsibilities?
The FDA considers you responsible for the AI's performance and validation, even if it comes from a third party [77]. You must:
- Establish vendor qualification procedures, which may include auditing the vendor's quality management and validation practices [77].
- Obtain full model documentation from the vendor, including architecture, training data provenance, and validation results [77].
- Perform context-specific validation within your own DBTL pipeline to ensure the model performs as expected for your specific intended use [77] [78].
4. What does the FDA mean by "continuous monitoring" and "lifecycle controls" for AI models?
AI validation is not a one-time event. The FDA expects ongoing monitoring and control throughout the model's lifecycle [77] [78]. This requires:
- Implementing drift detection: Deploy systems to monitor for data drift (changes in input data) and concept drift (changes in the relationship between input and output) in production [77] [76].
- Establishing a Pre-Determined Change Control Plan (PCCP): For ML-enabled medical devices, a PCCP outlines planned model updates and the validation procedures that will ensure safety and effectiveness without requiring a new submission for every change [78].
- Maintaining rigorous change control: Any change to the model, its data pipelines, or its operating environment must be managed through a formal change control process with documented validation [77].
Experimental Protocols for Key Validation Experiments
Protocol 1: Stratified Performance Validation Based on Problem Difficulty
This methodology ensures your model is evaluated on a challenge-balanced dataset, not just an "easy test set."
- Objective: To evaluate model performance across different levels of problem difficulty, providing a more realistic assessment of its real-world applicability.
- Methodology:
- Define Challenge Metrics: Identify a quantifiable metric that defines "challenge" for your task. In protein function prediction, this could be sequence similarity to the training set [75]. In molecule design, it could be structural novelty or synthetic complexity.
- Stratify the Test Set: Categorize each sample in your hold-out test set into difficulty tiers (e.g., Easy, Moderate, Hard) based on the defined metric.
- Validate and Report Separately: Run your model on the entire test set, then calculate and report performance metrics (e.g., Accuracy, Precision, Recall, F1-Score) for each difficulty tier separately [75].
- Interpretation: A model that performs well only on "Easy" problems is likely overfitted and not suitable for deployment. A robust model should maintain acceptable performance across all tiers.
Protocol 2: Bias and Fairness Assessment for Subgroups
This protocol checks for performance disparities across demographic or biological subgroups, a key regulatory concern.
- Objective: To detect and quantify unfair performance disparities (bias) across predefined patient or data subgroups.
- Methodology:
- Identify Subgroups: Define relevant subgroups based on demographic (e.g., age, sex, ethnicity) or biological (e.g., genetic subtype, disease stage) characteristics. Training data source is a key consideration here [79].
- Perform Subgroup Analysis: Calculate key performance metrics (Sensitivity, Specificity, PPV, etc.) for each subgroup and for the population as a whole.
- Quantify Disparity: Compare metrics across subgroups. Statistical tests can determine if observed disparities are significant.
- Interpretation: Significant performance degradation for any subgroup indicates potential bias. This must be mitigated through methods like data augmentation, re-sampling, or algorithm adjustments before regulatory submission [78] [80].
Data Presentation: Model Performance & Regulatory Transparency
Table 1: Key Performance Metrics for AI/ML Models in Regulatory Submissions This table summarizes essential metrics recommended by FDA guidance and scientific best practices for a comprehensive model evaluation [76] [79].
| Metric Category | Specific Metric | Description | Regulatory Significance |
|---|---|---|---|
| Discrimination | Sensitivity (Recall) | Ability to correctly identify positive cases. | Critical for diagnostic tools; high value minimizes missed cases [79]. |
| Specificity | Ability to correctly identify negative cases. | Important for ruling out conditions; reported for ~22% of devices [79]. | |
| Area Under the ROC Curve (AUROC) | Overall measure of classification ability across all thresholds. | Common aggregate metric; reported for ~11% of FDA-approved devices [79]. | |
| Predictive Value | Positive Predictive Value (PPV) | Probability a positive prediction is correct. | Crucial for clinical decision-making; reported for only 6.5% of devices [79]. |
| Negative Predictive Value (NPV) | Probability a negative prediction is correct. | Important for confirming safety; reported for only 5.3% of devices [79]. | |
| Fairness & Bias | Subgroup Performance | Comparison of metrics (e.g., Sensitivity) across demographic groups. | Expected by FDA to ensure equitable performance and mitigate bias [78] [79]. |
| Robustness | Performance on "Hard" Cases | Model accuracy on challenging, edge-case problems. | Indicates true model understanding and generalizability, beyond easy examples [75]. |
Table 2: FDA 2025 Draft Guidance - Key AI Validation Requirements This table summarizes actionable requirements from the latest FDA draft guidance for AI/ML in drug and device development [77] [78].
| Requirement Area | Key Expectation | Practical Action for Researchers |
|---|---|---|
| Context of Use (COU) | Precisely define the specific regulatory question the model informs. | Document the COU at project start, linking model design and validation directly to it [78]. |
| Data Quality & Provenance | Demonstrate data integrity (ALCOA+ principles) and representativeness. | Maintain immutable data lineage and versioned datasets. Analyze and document dataset demographics [77] [78]. |
| Model Credibility | Provide a risk-based justification for the model's credibility for its COU. | Create a validation plan that includes stress tests, uncertainty quantification, and performance monitoring plans [78]. |
| Predetermined Change Control Plans (PCCP) | For devices, a plan for safe and controlled model updates post-deployment. | Document types of planned updates, validation tests for each, and rollback procedures [78]. |
| Lifecycle Monitoring | Ongoing surveillance for model effectiveness and safety in the real world. | Deploy monitoring dashboards for data drift and performance metrics. Schedule periodic reviews [77] [78]. |
Workflow Visualization for AI Model Validation
The following diagram illustrates the core lifecycle for developing and validating an AI model in a regulatory context, integrating continuous monitoring and controlled updates as emphasized by the FDA.
AI Model Validation Lifecycle
The Scientist's Toolkit: Research Reagent Solutions
Table 3: Essential Tools & Frameworks for AI Validation
| Tool / Solution Category | Function in AI Validation | Relevance to DBTL Cycles |
|---|---|---|
| Explainability (XAI) Tools (e.g., LIME, SHAP) | Provides insights into model decision-making, helping to identify reliance on spurious correlations and build trust. | Critical in the "Learn" phase to understand model predictions and generate new, testable biological hypotheses [76]. |
| Bias Detection Frameworks (e.g., AI Fairness 360) | Automates the calculation of fairness metrics across different subgroups to identify discriminatory model behavior. | Ensures that DBTL automation does not amplify biases, which is a key regulatory requirement [80]. |
| MLOps Platforms (e.g., Galileo, Neptune) | Manages the machine learning lifecycle, including experiment tracking, model versioning, and performance monitoring. | Essential for maintaining reproducibility and audit trails across thousands of automated DBTL iterations [76]. |
| Data Versioning Tools (e.g., DVC) | Tracks versions of datasets and models together, ensuring full reproducibility of any model output. | Addresses FDA data integrity (ALCOA+) requirements by making data lineage attributable and traceable [77] [78]. |
| Predetermined Change Control Plan (PCCP) Template | A documented framework for planning and executing safe model updates post-deployment. | Allows for continuous learning and model improvement in the DBTL cycle within a pre-approved regulatory boundary [78]. |
Biomarker Discovery and Validation Techniques for Clinical Translation
Foundational Concepts: DBTL and Biomarker Development
What is the DBTL cycle and how is it applied to biomarker discovery?
The Design-Build-Test-Learn (DBTL) cycle is a systematic, iterative framework used in synthetic biology and biotechnology to engineer biological systems. When applied to biomarker discovery, it provides a structured approach for developing and validating biomarkers [14] [31].
- Design: Researchers define objectives for the desired biomarker and design experiments using computational tools and prior knowledge. This phase involves selecting potential molecular targets, planning genetic constructs if needed, and designing experimental workflows [6] [9].
- Build: This phase involves the high-throughput construction of biological components or the preparation of experimental samples. Automated laboratory systems synthesize DNA constructs, culture cells, or process biological samples for analysis [6] [14].
- Test: Experimental measurements are conducted to characterize the performance of candidate biomarkers. This includes molecular profiling using omics technologies, functional assays, and analytical validation [14] [81].
- Learn: Data collected during testing is analyzed to extract insights about biomarker performance. Results inform the next design phase, creating an iterative loop for continuous optimization [6] [31].
An emerging paradigm is the LDBT (Learn-Design-Build-Test) cycle, where machine learning on existing datasets precedes design, potentially accelerating the discovery process by generating more informed initial designs [9] [13].
What are the key phases of biomarker development from discovery to clinical use?
Biomarker development follows a structured pathway from initial discovery to clinical application, with distinct phases ensuring rigorous validation [81] [82]:
Table 1: Phases of Biomarker Development
| Phase | Objective | Typical Sample Numbers | Output |
|---|---|---|---|
| Discovery | Identify a large pool of candidate biomarkers using non-targeted approaches | Few samples, many analytes | Dozens to hundreds of candidate biomarkers [81] |
| Qualification/Screening | Confirm statistically significant abundance differences between disease and control groups | Tens to hundreds of samples | A refined list of candidate biomarkers [81] |
| Verification | Confirm target proteins using targeted methods | Varies based on disease complexity | 3-10 top candidates for validation [81] |
| Analytical Validation | Ensure the biomarker assay has reliable performance characteristics | Large sample sets | CLIA/CLSI-compliant assay with documented precision, accuracy, etc. [82] |
| Clinical Validation | Confirm the biomarker's utility in the intended clinical context | Large, diverse patient cohorts | Evidence connecting the biomarker to biological and clinical endpoints [82] |
| Regulatory Qualification | Obtain formal approval for the biomarker's use in drug development | Comprehensive data package | FDA or other regulatory agency qualification for specific context of use [82] |
Troubleshooting Common Experimental Challenges
How can I address the translational gap between preclinical biomarker promise and clinical utility?
The translational gap, where less than 1% of published cancer biomarkers enter clinical practice, can be addressed through several strategic approaches [83]:
Implement Human-Relevant Models: Replace traditional animal models with advanced systems that better mimic human biology, including:
Adopt Multi-Omics Technologies: Integrate genomics, transcriptomics, and proteomics to identify context-specific, clinically actionable biomarkers that may be missed with single-approach studies [83].
Apply Longitudinal Validation Strategies: Capture temporal biomarker dynamics through repeated measurements over time rather than single time-point snapshots, revealing subtle changes that may indicate cancer development or recurrence [83].
Utilize Functional Assays: Complement traditional correlative approaches with tests that confirm the biological relevance and therapeutic impact of candidate biomarkers [83].
What are the best practices for ensuring data quality in high-throughput biomarker studies?
Data quality is paramount in biomarker studies, particularly with complex high-dimensional data [84]:
Implement Rigorous Quality Control: Apply data type-specific quality metrics using established software packages:
Address Technical Noise and Bias: Quality checks should be applied both before and after preprocessing of raw data to ensure quality issues are resolved without introducing artificial patterns [84].
Standardize Data Formats: Adopt established annotation standards:
Handle Missing Values Appropriately:
- Remove attributes with large proportions of missing values (e.g., >30%)
- Use imputation methods or machine learning algorithms that tolerate limited missing values for features with smaller numbers of missing values [84]
Filter Uninformative Attributes: Remove features with zero or small variance, and consider additional filtering methods using sum of absolute covariances or tests of data distribution unimodality [84].
How can I effectively integrate different data types (e.g., clinical and omics data) in biomarker studies?
Multimodal data integration is essential for comprehensive biomarker development [84]:
Early Integration Methods: Extract common features from several data modalities first, then apply conventional machine learning. Example: Canonical Correlation Analysis (CCA) and sparse variants of CCA [84].
Intermediate Integration Algorithms: Join data sources while building the predictive model. Example: Support vector machine (SVM) learning with linear combinations of multiple kernel functions, or multimodal neural network architectures [84].
Late Integration Algorithms: Learn separate models for each data modality first, then combine predictions using meta-models trained on the outputs of data source-specific sub-models (stacked generalization) [84].
Assess Added Value of Omics Data: When traditional clinical markers exist, specifically evaluate whether omics data provides additional predictive value by using clinical data as a baseline in comparative evaluations [84].
Workflow Visualization
Biomarker Discovery and Validation Workflow
Enhanced DBTL Cycle for Biomarker Research
Experimental Protocols
Protocol: Quantitative Proteomics Workflow for Biomarker Discovery
This protocol outlines a standardized workflow for biomarker discovery using quantitative proteomics [81].
Sample Preparation (Blood)
- Plasma Collection: Collect blood in EDTA or heparin tubes, gently invert immediately to mix, centrifuge at 3000 rpm for 10 minutes at 4°C, transfer supernatant (plasma) to clean tubes [81].
- Serum Collection: Collect blood in serum-separator tubes containing coagulant, allow sample to clot at room temperature for 60 minutes (do not shake), centrifuge at 3000 rpm for 10 minutes at 4°C, aliquot supernatant (serum) [81].
- Considerations: Plasma is generally preferred over serum due to simpler sampling, more consistent proteome, and less effect from platelet-derived constituents [81].
Data Acquisition Methods Table 2: Mass Spectrometry Techniques for Proteomic Biomarker Discovery
| Technique | Labeling | Identification Level | Advantages | Disadvantages |
|---|---|---|---|---|
| Label-Free DDA | None | MS2 | Broad applicability | Lower quantitative accuracy and reduced identification depth [81] |
| DIA (Data Independent Acquisition) | None | MS2 | Broad applicability; comprehensive data; accurate quantitation | Complex data processing [81] |
| TMT/iTRAQ | Labeled | MS2 | Accurate identification; good reproducibility | Ratio compression (reduced sensitivity); reagent batch effects [81] |
| PRM (Parallel Reaction Monitoring) | Targeted quantitation | MS2 | High sensitivity and accuracy; absolute quantitation achievable | Low protein-level throughput [81] |
Statistical Analysis and Candidate Filtering
- Initial Screening: Use t-test for two-group comparisons or ANOVA for multi-group comparisons, combined with fold-change (FC) analysis. Typical thresholds: FC > 1.5-2.0 and FDR < 0.05 [81].
- Machine Learning Approaches:
- Split data into training and validation sets
- Apply random forests, support vector machines, deep neural networks, or naïve Bayes algorithms
- Build predictive models and evaluate classification accuracy [81]
- Functional Analysis: Integrate protein expression data with pathway analysis and clinical phenotypic data for candidate prioritization [81].
Validation Approaches
- Parallel Reaction Monitoring (PRM): MS-based targeted detection that eliminates need for antibodies, enables simultaneous measurement of dozens of proteins in a single run [81].
- ELISA: Antibody-based quantification, useful for specific proteins with well-validated commercial antibodies, but limited by antibody availability and quality [81].
- Western Blot: Semi-quantitative verification of protein identity and approximate abundance, but lower throughput and precision [81].
Protocol: Implementing a Knowledge-Driven DBTL Cycle for Strain Engineering
This protocol demonstrates the application of DBTL cycles with a case study on dopamine production in E. coli, illustrating principles applicable to biomarker research [31].
Knowledge-Driven Design Phase
- Conduct upstream in vitro investigation to inform initial design
- Use computational tools for designing genetic components
- Apply prior knowledge from literature and existing datasets [31]
Build Phase Implementation
- Utilize high-throughput ribosome binding site (RBS) engineering for precise fine-tuning of gene expression
- Implement automated genetic construction using robotic liquid handling systems
- Employ standardized genetic assembly systems (e.g., Golden Gate assembly, Gibson assembly) [31]
Test Phase Methodology
- Set up controlled cultivation experiments using defined media
- Implement analytical methods for quantifying target molecules (HPLC, MS)
- Perform functional assays to validate biological activity [31]
Learn Phase Analysis
- Apply statistical analysis to evaluate strain performance
- Use computational models to identify key factors influencing productivity
- Integrate findings to inform next DBTL cycle [31]
Research Reagent Solutions
Table 3: Essential Research Reagents and Platforms for Biomarker Discovery
| Reagent/Platform | Function | Application Notes |
|---|---|---|
| PDX (Patient-Derived Xenografts) Models | Recapitulate characteristics of human cancer, including tumor progression and evolution | More accurate for biomarker validation than conventional cell line-based models [83] |
| Organoids | 3D structures that retain characteristic biomarker expression better than 2D cultures | Used to predict therapeutic responses and guide personalized treatment selection [83] |
| 3D Co-Culture Systems | Incorporate multiple cell types to model human tissue microenvironment | Essential for replicating in vivo environments and cellular interactions [83] |
| Cell-Free Expression Systems | Protein biosynthesis machinery for in vitro transcription and translation | Rapid (>1 g/L protein in <4 h); enable production without time-intensive cloning [9] |
| Multi-Omics Technologies | Integrate genomics, transcriptomics, proteomics to identify context-specific biomarkers | Identifies biomarkers that may be missed with single-approach studies [83] |
| SomaScan/Olink Platforms | Large-scale screening for biomarker discovery | Enable discovery with big platforms, but require significant investment for validation [82] |
| Automated Liquid Handling Robots | Standardize sample handling and processing | Reduce manual errors, ensure consistency, and enable high-throughput workflows [85] |
Frequently Asked Questions
What are the most common reasons for biomarker failure in clinical translation?
Biomarker failure often results from [83] [82]:
- Poor Human Correlation of Preclinical Models: Over-reliance on traditional animal models that do not adequately reflect human disease biology [83].
- Disease Heterogeneity: Human populations display genetic diversity, varying treatment histories, comorbidities, and progressive disease stages that cannot be fully replicated in controlled preclinical settings [83].
- Inadequate Validation Frameworks: Lack of robust, reproducible validation methodologies across different cohorts and laboratories [83].
- Technical and Hypothesis-Driven Failures: Both technical assay issues and incorrect biological hypotheses contribute to failures [82].
- Economic Factors: The high cost of validation and qualification, coupled with the challenge of changing clinical practice, creates significant barriers [82].
How can artificial intelligence and machine learning transform biomarker discovery?
AI and ML are transforming biomarker discovery through [83] [85]:
- Pattern Detection in Complex Data: Identifying hidden patterns in large, multi-omics datasets that traditional methods might miss [85].
- Predictive Modeling: Predicting clinically relevant correlations between biomarkers and disease states, improving candidate selection [85].
- Reduction of False Positives: Applying advanced algorithms that account for nonlinear relationships and high dimensionality of omics data [85].
- Accelerated Analysis: Automating data integration, feature selection, and model building to shorten timelines from experiment to discovery [85].
- Enhanced DBTL Cycles: Enabling zero-shot predictions that improve initial design quality, potentially reducing the number of experimental iterations needed [9].
What strategies can improve the integration of automated systems in biomarker workflows?
Successful integration of automation requires [85]:
- Centralized Data Systems: Implement interconnected data platforms that automatically capture raw or pre-processed outputs from instruments, reducing manual errors and ensuring consistency [85].
- Standardized Processing Workflows: Use built-in, assay-specific pipelines that deliver reliable, reproducible results with full metadata traceability [85].
- Robotic Sample Processing: Leverage robotic platforms for biological sample preparation to ensure precision, reproducibility, and high throughput [85].
- AI-Driven Analytics: Embed machine learning pipelines to identify clinically relevant correlations and support real-time data review and interpretation [85].
- Audit Trail Documentation: Implement built-in audit trails and traceability features to support GxP and regulatory requirements [85].
In the context of automated Design-Build-Test-Learn (DBTL) cycle iteration research, managing data effectively is paramount. The architecture chosen to handle the vast amounts of data generated from automated experiments, high-throughput screening, and AI-driven analysis can significantly impact the speed, efficiency, and success of drug development. This analysis compares two predominant architectural frameworks: the traditional Centralized Automation architecture and the decentralized Data Mesh paradigm. The goal is to provide a clear technical foundation for troubleshooting common data management issues within research environments.
Architectural Comparison at a Glance
The table below summarizes the core differences between Centralized and Data Mesh architectures, which form the basis for many troubleshooting scenarios.
| Feature | Centralized Automation Architecture | Data Mesh Architecture |
|---|---|---|
| Philosophy | Technology-focused; unified technical integration [86] | Organizational and cultural; distributed data ownership [86] |
| Control & Governance | Centralized control and unified governance enforced by a single platform team [86] [87] | Federated governance; global standards set centrally but executed by domain teams [88] [86] |
| Data Ownership | Central data team owns and manages all data [88] | Business domains (e.g., Bioassays, Chemistry) own their data as products [88] [86] |
| Primary Focus | Seamless integration, automated workflows, and consistent interfaces [86] | Domain autonomy, organizational agility, and empowered teams [86] [89] |
| Scalability | Scales vertically; the central platform requires more power as demands grow [86] | Scales horizontally; new business units or domains are added independently [86] |
| Best Suited For | Technical integration challenges, strong compliance needs, limited data team resources [86] | Large, complex organizations with mature, capable teams and clear domain boundaries [86] |
Troubleshooting Guides and FAQs
FAQ 1: How do I diagnose and resolve data access bottlenecks in a centralized automation architecture?
Issue: Researchers in domains like "High-Throughput Screening" report long delays in receiving curated datasets from the central data team, slowing down the DBTL cycle.
Diagnosis and Resolution:
- Identify the Bottleneck: Check the request queue for the central data team. A consistently long backlog indicates a structural bottleneck where a single team is overwhelmed by requests from multiple domains [90].
- Short-Term Mitigation: Implement a priority system for requests and increase the use of automated data ingestion and transformation tools within the central platform to improve throughput [86].
- Long-Term Solution: Evaluate a shift towards a Data Mesh. In this model, the "High-Throughput Screening" domain would own and manage its data as a product, providing direct access to other researchers and eliminating the central bottleneck [88] [89]. This empowers individual domains and increases overall efficiency [89].
FAQ 2: Our AI/ML models for predictive chemistry are underperforming due to poor data quality. How can we improve data trustworthiness?
Issue: Data from different domains (e.g., "Proteomics" and "Metabolomics") is inconsistent, poorly documented, or lacks clear lineage, leading to unreliable model training.
Diagnosis and Resolution:
- For Centralized Architecture: The central team must enforce rigorous, unified data quality checks and lineage tracking across all ingested data. AI-powered automation can help monitor quality and enforce governance policies [86].
- For Data Mesh Architecture: Leverage the "data as a product" principle. Mandate that each domain's data products must be discoverable (listed in a central catalog), self-describing (with clear syntax and semantics), and trustworthy (with defined service-level objectives for quality) [88]. Federated governance ensures that global quality standards are met while domains retain control over their data [88] [86].
FAQ 3: What are the key technical and cultural challenges when implementing a Data Mesh, and how can we overcome them?
Issue: An organization plans to transition from a centralized data lake to a Data Mesh but faces resistance and technical hurdles.
Diagnosis and Resolution:
- Cultural Challenge: Data Mesh requires a significant shift from a centralized to a decentralized ownership model. It demands buy-in from domains and management, as it changes teams' roles and responsibilities [89].
- Solution: Develop a robust change management strategy. Clearly communicate the benefits and new responsibilities to all stakeholders. Start with a pilot domain that is both enthusiastic and technically capable [89].
- Technical Challenge: Distributing data ownership can lead to inconsistent governance and integration complexity if not managed correctly [89].
- Solution: Invest in a self-serve data infrastructure platform. This platform provides domain teams with the tools to easily build, manage, and govern their data products, ensuring consistency and reducing duplication of effort [88]. A "Mesh on Fabric" hybrid approach can also help, where a data fabric provides the underlying technical integration and automation, while the mesh principles guide the organizational structure [86].
Experimental Protocol: Evaluating Architecture Performance in a Simulated DBTL Cycle
Objective: To quantitatively compare the efficiency and researcher satisfaction of Centralized vs. Data Mesh architectures in managing data for an automated drug formulation screening workflow.
Methodology:
- Setup: Simulate a research environment with three domains: "Compound Management," "Bioassay," and "Analytical Chemistry." Implement both a Centralized architecture (with a central data platform team) and a Data Mesh architecture (with domain-owned data products) in parallel for identical, simulated DBTL cycles.
- Data Product Definition: In the Data Mesh arm, each domain creates and maintains its data products (e.g., "Compound Library Inventory," "IC50 Assay Results," "Chromatography Purity Data") that are discoverable, addressable, and trustworthy [88].
- Metric Tracking:
- Data Retrieval Latency: Measure the time from a data request to its fulfillment for cross-domain queries.
- Pipeline Iteration Time: Measure the time required to modify a data pipeline in response to a new experimental protocol.
- Researcher Satisfaction: Survey scientists on their perceived autonomy and ability to access needed data.
Expected Outcome: The Data Mesh architecture is anticipated to show lower data retrieval latency and faster pipeline iteration times for domain-specific changes, as it removes central bottlenecks and empowers domain experts [86] [89]. The centralized architecture may perform better for enterprise-wide reporting and compliance audits due to its unified nature [86].
Architectural Workflows and Signaling
Diagram: Centralized vs. Data Mesh Data Flow
Diagram: Data Mesh "Data as a Product" Principle
The Scientist's Toolkit: Key Research Reagent Solutions
The following tools and platforms are essential for implementing and managing the data architectures discussed, directly supporting automated DBTL research.
| Tool / Solution | Function | Relevance to Architecture |
|---|---|---|
| Self-Serve Data Platform (e.g., AWS/Azure Data Services) | Provides underlying infrastructure (data lakes, compute) and automation tools for domain teams to build data products without managing complex backend systems [88]. | Data Mesh: Foundational for enabling domain self-service and implementing the "mesh on fabric" hybrid pattern [88] [86]. |
| Active Metadata Manager | Uses AI/ML to automatically discover, catalog, and track data lineage, relationships, and quality across all sources [86]. | Centralized & Data Fabric: Core "brain" for integration. Data Mesh: Crucial for federated governance and data discoverability. |
| Orchestration Engine (e.g., Apache Airflow, CI/CD Pipelines) | Coordinates and manages automated workflows, such as data pipeline execution and network configuration tasks [87]. | Universal: Critical for automating the "Build" and "Test" phases of the DBTL cycle in any architecture. |
| Source of Truth Platform (e.g., NetBox for IT, Electronic Lab Notebooks for Research) | Serves as the authoritative repository for specific data types, ensuring automation tools operate on accurate, consistent information [87]. | Universal: Prevents configuration drift and data quality issues. Essential for reproducible research. |
| Federated Computational Governance Policy | A set of global, centrally defined standards (e.g., for data formats, security) that are computationally enforced across domain data products [88]. | Data Mesh: Enables scalable governance in a decentralized environment, balancing autonomy with global compliance. |
Troubleshooting Common Compliance Workflow Issues
1. Issue: Automated data processing lacks a lawful basis under GDPR.
- Problem: An automated workflow processes EU resident data for a new research purpose without a proper legal basis, violating the principle of lawfulness [91].
- Solution: Before initiating any new automated data processing, verify a valid legal basis exists. For purposes beyond the original research scope, obtain new, explicit user consent. Implement a consent management platform that records the purpose, time, and method of consent collection to demonstrate compliance [91] [92].
2. Issue: Failure to execute Data Subject Access Requests (DSARs) within mandated timelines.
- Problem: A researcher receives a request from a study participant to access their data, but the decentralized data storage in the automated workflow makes it impossible to fulfill the request within the GDPR's one-month deadline [93].
- Solution: Establish a clear, documented process for receiving, tracking, and fulfilling DSARs. Utilize software tools that can automatically discover, collate, and redact personal data across different systems and databases to streamline the response process [93].
3. Issue: Inability to encrypt Protected Health Information (PHI) at rest and in transit.
- Problem: An automated data pipeline transfers health data from a clinical device to a central database without end-to-end encryption, creating a vulnerability that violates both HIPAA and GDPR [94] [95].
- Solution: Implement strong encryption protocols (e.g., AES-256) for data at rest in databases and archives. Use transport layer security (TLS) for all data in transit. Regularly review and update encryption methodologies to align with current security standards [94] [92].
4. Issue: Absence of a Data Protection Impact Assessment (DPIA) for new workflows.
- Problem: A new automated AI model for analyzing patient data is integrated into the research workflow without a prior assessment of its privacy risks [93].
- Solution: Incorporate DPIAs as a mandatory step in your project management lifecycle for any new process, system, or tool that handles personal data. The DPIA should identify the need for data, processing risks, and mitigation measures before launch [93].
5. Issue: Third-party vendor in an automated pipeline causes a data breach.
- Problem: A cloud analytics service used in your workflow suffers a breach, exposing processed personal data. Your organization remains liable for the vendor's compliance [93].
- Solution: Perform thorough due diligence on all vendors before engagement. Execute formal contracts like Business Associate Agreements (BAAs) for HIPAA or Data Processing Agreements (DPAs) for GDPR that explicitly outline their data protection responsibilities and breach notification protocols [92] [96].
Frequently Asked Questions (FAQs)
Q1: Our automated research workflow handles data from both the EU and the US. Does complying with HIPAA mean we are also compliant with GDPR?
- A: No. While there is overlap (e.g., requiring security safeguards and breach notifications), significant differences exist. GDPR has stricter consent requirements, includes a "Right to Be Forgotten," and mandates faster breach reporting (72 hours vs. HIPAA's 60 days for large breaches). You must comply with both sets of regulations where applicable [92] [96].
Q2: Who in our organization needs to be involved to ensure an automated workflow is compliant from the start?
- A: A collaborative approach is essential. This includes researchers and scientists (to define data use), IT and security teams (to implement technical controls), legal or compliance officers (to interpret regulations), and a Data Protection Officer (DPO) if required by GDPR [92] [96].
Q3: What is the single most common mistake to avoid when setting up a compliant automated workflow?
- A: Storing or processing regulated data (PHI/PII) on non-compliant cloud servers or services. Always use certified, compliant cloud platforms (like AWS, Azure, Google Cloud with signed BAAs) and ensure encryption is enabled by default for all data [95].
Q4: If our automated workflow uses AI to analyze clinical trial data, what extra steps are needed?
- A: Beyond core GDPR/HIPAA rules, the EU's AI Act may impose additional obligations. You must assess if your AI system is "high-risk," which requires enhanced transparency, robust data quality controls, and specific risk management measures [93].
Automated Compliance Workflow Diagram
This diagram visualizes an integrated technical workflow designed to meet key requirements of HIPAA, GDPR, and FDA regulations within an automated research environment.
Research Reagent Solutions for Compliance
The following tools and agreements are essential "reagents" for building and maintaining compliant automated research workflows.
| Tool / Solution Category | Function & Purpose | Key Considerations for Implementation |
|---|---|---|
| Consent Management Platform (CMP) | Manages user consent for data collection and processing, providing a legal basis under GDPR. Essential for recording and tracking user permissions [91]. | Must provide granular control, allow for easy consent withdrawal, and maintain detailed, auditable records of when and how consent was obtained [91]. |
| Data Encryption Tools | Protects data confidentiality as required by both HIPAA Security Rule and GDPR. Renders data unreadable to unauthorized parties, mitigating breach impact [94] [92]. | Must be applied to data both in transit (e.g., using TLS) and at rest (e.g., using AES-256 encryption in databases and file stores) [94] [95]. |
| Governance, Risk & Compliance (GRC) Platforms | Automates evidence collection, continuous compliance monitoring, and risk assessment. Simplifies audit preparation for multiple frameworks (HIPAA, GDPR, SOC 2) [94]. | Look for platforms with pre-built policy templates and integrations with your existing cloud infrastructure (AWS, Azure, GCP) and identity management systems [94]. |
| Data Discovery & Classification Software | Automatically scans data repositories to identify and classify sensitive information (PHI/PII). Crucial for understanding your data landscape and applying appropriate controls [94]. | Effective implementation requires defining accurate classification rules (e.g., for patient IDs, names) and integrating findings with access control and encryption systems [94]. |
| Business Associate Agreement (BAA) / Data Processing Agreement (DPA) | Legal contracts that bind third-party vendors (Business Associates/Processors) to the same data protection standards as your organization, as required by law [92] [96]. | These are not merely formalities; they must clearly delineate roles, security requirements, and procedures for handling data breaches [93] [96]. |
Key Regulatory Feature Comparison
This table provides a concise, quantitative comparison of core requirements across HIPAA, GDPR, and FDA relevant to automated research workflows.
| Feature | HIPAA | GDPR | FDA (21 CFR Part 11) |
|---|---|---|---|
| Primary Scope | U.S. healthcare data (PHI) [92] | Personal data of EU individuals (PII) [92] | Electronic records & signatures [96] |
| Breach Reporting Deadline | Up to 60 days [92] | 72 hours [92] | Not specified (requires prompt reporting) |
| Maximum Potential Fine | $1.5 million per year [96] | €20 million or 4% of global revenue [92] | Varies by violation |
| Right to Erasure | No (with exceptions) [92] | Yes ("Right to be Forgotten") [92] | No (for audit integrity) |
| Requires a DPO | Not explicitly | Yes, under certain conditions [92] [96] | No |
| Audit Trail Requirement | Implied for accountability | Implied for accountability | Explicitly required [96] |
Benchmarking Automated DBTL Performance Against Traditional Methods
Troubleshooting Guide: Automated DBTL Implementation
This guide addresses common challenges researchers face when implementing and benchmarking automated Design-Build-Test-Learn (DBTL) pipelines against traditional methods.
Q: Our automated DBTL pipeline shows excellent accuracy metrics but deployment performance is unsatisfactory. What could be causing this?
A: This common issue often stems from latency and computational overhead in real-world deployment scenarios. Focus on these areas:
- Model Optimization: Implement pruning to remove redundant network weights and quantization to use lower-precision arithmetic, reducing computational burden without significantly compromising predictive fidelity [97].
- Hardware Utilization: Deploy specialized accelerators like FPGAs or TPUs and optimize memory access patterns to reduce cache misses [97].
- Data Pipeline Optimization: Use asynchronous processing to decouple I/O from inference tasks and implement intelligent data caching [97].
Q: How can we ensure our benchmark comparisons between automated and traditional DBTL methods are scientifically valid?
A: Avoid these common experimental flaws that compromise benchmarking validity [98]:
- Implement Control Groups: Maintain parallel baseline cases to account for time-based, urgency-based, and other hard-to-control variables.
- Limit Variables: Avoid simultaneously changing multiple parameters, which makes it impossible to determine which factors drive performance differences.
- Control Selection Bias: Test under realistic conditions rather than with all-star teams or extra resources that don't reflect normal operations.
- Define Clear Metrics: Establish validated measurement systems with explicit success/failure criteria before experiments begin.
Q: Our automated pipeline struggles with data quality issues that undermine performance. What strategies can help?
A: Data quality significantly impacts automated DBTL performance. Implement these approaches [99]:
- Automated Data Preprocessing: Deploy automated data cleaning, missing data imputation, and categorical data encoding techniques.
- Feature Engineering: Utilize automated feature extraction, construction, and selection methods to enhance data quality.
- Skewness Reduction: Apply transformations like Quantile Uniform normalization to address feature skewness while preserving critical patterns [100].
- Multi-Layered Feature Selection: Combine correlation analysis with statistical validation to enhance discriminative power [100].
Q: What are the key differences in resource requirements between automated and traditional DBTL approaches?
A: Consider these resource allocation differences:
Table: Resource Comparison Between DBTL Approaches
| Resource Factor | Automated DBTL | Traditional Methods |
|---|---|---|
| Initial Investment | High (tools, infrastructure, training) [101] | Lower initial costs |
| Computational Demands | Significant (deep learning models require substantial resources) [100] | Moderate computational needs |
| Execution Time | Faster iteration cycles once established [42] | Slower, manual processes |
| Team Skills | Requires scripting/coding, AI/ML expertise [101] | Domain knowledge, manual experimentation |
| Infrastructure | Often requires specialized hardware accelerators [97] | Standard laboratory equipment |
Q: How can we address the skills gap when transitioning from traditional to automated DBTL methods?
A: Bridge the skills gap through strategic team development [101]:
- Focused Learning: Provide training in scripting languages, API testing, and specific frameworks through platforms like Udemy or Pluralsight.
- Knowledge Blending: Combine manual testers' deep domain knowledge with automation specialists' technical skills.
- Exploration Time: Allocate dedicated time for team members to experiment with emerging technologies and attend relevant webinars.
Experimental Protocols for DBTL Benchmarking
Protocol 1: Valid Experimental Design for DBTL Performance Comparison
Follow this methodology to ensure scientifically rigorous comparisons [98]:
- Define Purpose and Gap: Clearly articulate why the comparison is important and what specific gap you aim to address.
- Formulate Hypothesis: Develop testable hypotheses about what causes performance differences and which countermeasures might address them.
- Establish Measurement System: Define and validate metrics before experiments begin, including both classification accuracy and computational efficiency measures.
- Control Variables: Use orthogonal arrays combined with Latin square designs to efficiently explore design spaces while maintaining statistical validity [42].
- Implement Parallel Baseline: Run control groups simultaneously to account for environmental variations.
- Analyze Results: Apply statistical methods to identify relationships between design factors and performance outcomes [42].
Protocol 2: End-to-End Automated DBTL Pipeline Implementation
This protocol is adapted from successful microbial production pipelines [42]:
Design Phase:
- Use computational tools like RetroPath and Selenzyme for automated pathway and enzyme selection.
- Design reusable DNA parts with optimized ribosome-binding sites and coding regions using tools like PartsGenie.
- Combine genetic parts into combinatorial libraries, then statistically reduce using Design of Experiments (DoE).
Build Phase:
- Implement automated ligase cycling reaction for pathway assembly on robotics platforms.
- Transform constructs into production chassis.
- Quality check constructs through automated purification, restriction digest, and sequence verification.
Test Phase:
- Run automated multi-well growth/induction protocols.
- Detect targets and intermediates using automated extraction followed by quantitative screening.
- Process data using custom computational scripts.
Learn Phase:
- Identify relationships between production levels and design factors using statistical methods.
- Apply machine learning to inform next design iterations.
- Implement weighted voting ensembles combining multiple model types for superior performance [100].
Performance Benchmarking Data
Table: Quantitative Performance Comparison Framework
| Performance Metric | Automated DBTL | Traditional Methods | Measurement Protocol |
|---|---|---|---|
| Pathway Optimization Efficiency | 500-fold improvement in 2 cycles [42] | Typically requires more iterations | Titers measured via UPLC-MS/MS [42] |
| Accuracy Performance | Up to 100% on standardized datasets [100] | Varies by technique | Cross-validation across multiple datasets [100] |
| Computational Latency | Varies with model complexity [97] | Generally lower | End-to-end processing time measurement [97] |
| Resource Requirements | Higher initial investment [101] | Lower upfront costs | ROI calculation including setup and defect fixation [101] |
| Adaptation Capability | Dynamic adjustment based on statistical feedback [42] | Manual redesign required | Response to design parameter modifications [42] |
The Scientist's Toolkit: Research Reagent Solutions
Table: Essential Components for Automated DBTL Implementation
| Component | Function | Implementation Example |
|---|---|---|
| RetroPath [42] | Automated pathway selection | In silico enzyme selection for biosynthetic pathways |
| Selenzyme [42] | Enzyme selection and analysis | Automated identification of suitable biocatalysts |
| PartsGenie [42] | DNA part design | Optimization of ribosome-binding sites and coding regions |
| Weighted Voting Ensemble [100] | Enhanced prediction accuracy | Combining CNN, BiLSTM, Random Forest, and Logistic Regression |
| Quantile Uniform Transformation [100] | Feature skewness reduction | Preprocessing to achieve near-zero skewness (0.0003) |
| Multi-Layered Feature Selection [100] | Enhanced discriminative power | Combining correlation analysis, Chi-square statistics, and distribution analysis |
Automated DBTL Workflow Architecture
DBTL Implementation Workflow
Conclusion
Successfully addressing the challenges in automated DBTL iteration requires a balanced, strategic approach that integrates cutting-edge technology with strong foundational processes. The key takeaways involve starting with clear goals and well-mapped processes, adopting AI and data automation to enhance speed and insight, fostering collaboration to bridge technical and domain expertise, and embedding validation and compliance from the outset. Looking forward, the convergence of agentic AI, explainable AI models, and more sophisticated process intelligence will further accelerate the transition to fully autonomous discovery systems. This evolution promises to reshape biomedical research, enabling the rapid development of personalized therapies and breakthroughs in treating complex diseases like cancer, ultimately bringing effective treatments to patients faster.
References
- 1. How Healthcare APIs Solve Legacy System Connection ... [https://www.capminds.com/blog/how-healthcare-apis-solve-legacy-system-connection-challenges/]
- 2. Key Challenges in Clinical Trial Data Management [https://ccrps.org/clinical-research-blog/challenges-in-clinical-trial-data-management]
- 3. Navigating AI Integration in Pharma's Legacy Systems [https://www.pharma-iq.com/manufacturing/articles/navigating-ai-integration-in-pharmas-legacy-systems]
- 4. The Dangers of Legacy Systems in Healthcare [https://ralabs.org/blog/the-dangers-of-legacy-systems-in-healthcare/]
- 5. How legacy systems disrupt patient care [https://www.paubox.com/blog/how-legacy-systems-disrupt-patient-care]
- 6. Frontiers in biofoundry: opportunities and challenges [https://www.frontiersin.org/journals/synthetic-biology/articles/10.3389/fsybi.2025.1630026/full]
- 7. Modernization of Legacy System Generates Efficiency and ... [https://actdigital.com/en/cases/modernization-of-legacy-system-generates-efficiency-and-security-for-the-pharmaceutical-industry/]
- 8. Issues in Biomedical Research Data Management and Analysis [https://pmc.ncbi.nlm.nih.gov/articles/PMC2244904/]
- 9. LDBT instead of DBTL: combining machine learning and ... [https://pmc.ncbi.nlm.nih.gov/articles/PMC12589603/]
- 10. What Are Data Silos and How to Eliminate Them [https://www.sap.com/resources/what-are-data-silos]
- 11. What is Data Fragmentation? 8 Strategies to Solve & Combat [https://www.tierpoint.com/blog/data-fragmentation/]
- 12. How Integrations Are Revolutionizing Project Workflows [https://arcoro.com/resources/breaking-down-silos-how-integrations-are-revolutionizing-project-workflows]
- 13. LDBT: Machine Learning Meets Rapid Cell-Free Testing [https://bioengineer.org/ldbt-machine-learning-meets-rapid-cell-free-testing/]
- 14. DBTL Approach in Synthetic Biology [https://www.moleculardevices.com/applications/synthetic-biology/dbtl-approach]
- 15. Simulated Design–Build–Test–Learn Cycles for Consistent ... [https://pmc.ncbi.nlm.nih.gov/articles/PMC10510747/]
- 16. The Trends and Training That Will Drive the Future of Drug ... [https://www.appliedclinicaltrialsonline.com/view/empowering-workforce-future-trends-training-drug-development]
- 17. Bridging the AI Talent Gap in Medical Device & Life Sciences [https://www.manpower.com/en/insights/blogs/talent-gap-in-medical-device-life-sciences]
- 18. Optimizing the DBTL cycle to scale engineering biology [https://www.evonetix.com/white-papers/optimizing-the-design-build-test-learn-cycle-in-synthetic-biology]
- 19. Technologies for design-build-test-learn automation and ... [https://link.springer.com/article/10.1007/s13721-024-00455-4]
- 20. Robotic-based Experimental Procedure for Colorimetric ... [https://www.jove.com/t/67940/robotic-based-experimental-procedure-for-colorimetric-gas-sensing]
- 21. An automated Design-Build-Test-Learn pipeline for enhanced ... [https://pmc.ncbi.nlm.nih.gov/articles/PMC6123781/]
- 22. a solution to involution of design–build–test–learn cycle [https://www.sciencedirect.com/science/article/abs/pii/S0958166922000453]
- 23. Insider's Guide to Prioritizing Automation for Rapid ROI [https://argondigital.com/blog/business-process-automation/methods-for-prioritizing-automation/]
- 24. The future of pharmaceuticals: Artificial intelligence in drug ... [https://www.sciencedirect.com/science/article/pii/S2095177925000656]
- 25. Automating the design-build-test-learn cycle towards next- ... [https://www.sciencedirect.com/science/article/pii/S187167842300002X]
- 26. Process Optimization for DTC Brands with Philip Pauli [https://www.admetrics.io/en/post/process-optimization-for-dtc-brands]
- 27. The Lazy Data Scientist's Guide to AI/ML Troubleshooting [https://odsc.medium.com/the-lazy-data-scientists-guide-to-ai-ml-troubleshooting-abaf20479317?source=post_internal_links---------0----------------------------]
- 28. The State of Data and AI Engineering 2025 [https://lakefs.io/blog/the-state-of-data-ai-engineering-2025/]
- 29. 10 Data + AI Observations for Fall 2025 [https://towardsdatascience.com/10-data-ai-observations-to-watch-in-fall-2025/]
- 30. Machine Learning Trends 2025: What Every ML Engineer ... [https://devbysatyam.medium.com/machine-learning-trends-2025-what-every-ml-engineer-should-know-70159c5a3b29?source=rss------artificial_intelligence-5]
- 31. The knowledge driven DBTL cycle provides mechanistic ... [https://microbialcellfactories.biomedcentral.com/articles/10.1186/s12934-025-02729-6]
- 32. Troubleshooting AI‑powered Customer Experience Chatbots [https://alhena.ai/blog/troubleshooting-ai-powered-customer-experience-chatbots-a-practical-guide/]
- 33. Streaming analytics: Top 5 use cases, challenges, and best ... [https://www.instaclustr.com/education/real-time-streaming/streaming-analytics-top-5-use-cases-challenges-and-best-practices/]
- 34. Best Practices for Real-Time Stream Processing [https://www.striim.com/blog/6-best-practices-for-real-time-data-movement-and-stream-processing/]
- 35. Real time data streaming: 4 use cases, 5 components and ... [https://www.instaclustr.com/education/real-time-streaming/real-time-data-streaming-4-use-cases-5-components-and-6-best-practices/]
- 36. 5 Challenges to Deploying Real-Time Data Streaming ... [https://www.computer.org/publications/tech-news/trends/5-challenges-to-deploying-real-time-data-streaming-platforms]
- 37. Real-Time Data Processing Tools: Latest Developments and ... [https://taogang.medium.com/real-time-data-processing-tools-latest-developments-and-trends-8b8296957366]
- 38. Machine Learning Guided Batched Design of a Bacterial ... [https://pmc.ncbi.nlm.nih.gov/articles/PMC9295160/]
- 39. A generalized platform for artificial intelligence-powered ... [https://www.nature.com/articles/s41467-025-61209-y]
- 40. Towards a fully automated algorithm driven platform for ... [https://pmc.ncbi.nlm.nih.gov/articles/PMC6853954/]
- 41. Engineering biological systems using automated ... [https://www.sciencedirect.com/science/article/abs/pii/S1096717617300502]
- 42. An automated Design-Build-Test-Learn pipeline for ... [https://www.nature.com/articles/s42003-018-0076-9]
- 43. Application of Low-Code Platforms to Enable and ... [https://www.sciencedirect.com/science/article/pii/S2472630325001116]
- 44. Low-Code Automation in the Pharma Supply Chain [https://supplychainwizard.com/low-code-automation-in-the-pharma-supply-chain-accelerating-digital-transformation-without-ai/]
- 45. 10 Innovative Low-Code Automation Platforms for 2025 [https://kanerika.com/blogs/low-code-automation-platforms/]
- 46. Implementing Lab Workflow Automation in the Pharma ... [https://www.janeasystems.com/blog/lab-workflow-automation-in-pharma]
- 47. Transforming Global Drug Development Processes with ... [https://princetonblue.com/global-drug-development-processes-workflow-automation/]
- 48. The research tech stack 2025 [https://medium.com/design-bootcamp/the-research-tech-stack-2025-3e4f34935be9]
- 49. Agentic AI: Autonomous Experimentation - Strategic Intelligence [https://www.intelligencestrategy.org/blog-posts/agentic-ai-autonomous-experimentation]
- 50. Accelerating Drug Discovery Through Agentic AI: A Multi- ... [https://arxiv.org/html/2507.09023v1]
- 51. GraspJ: an open source, real-time analysis package for super ... [https://optnano.springeropen.com/articles/10.1186/2192-2853-1-11]
- 52. Test Automation ROI: A Strategic Guide for QA and ... [https://testgrid.io/blog/roi-on-test-automation/]
- 53. How to Address Software Testing Bottlenecks [https://www.practitest.com/resource-center/blog/how-to-address-software-testing-bottlenecks/]
- 54. How Test Management Tools Reduce QA Bottlenecks [https://www.testmonitor.com/blog/how-test-management-tools-reduce-qa-bottlenecks]
- 55. Test Automation ROI: How to Calculate the ... - Sandra Parker [https://sandra-parker.medium.com/test-automation-roi-how-to-calculate-the-roi-of-test-automation-e3a9f259d333]
- 56. Data Quality Problems? 8 Ways to Fix Them in 2025 [https://atlan.com/data-quality-problems/]
- 57. Five Predictions That Will Drive R&D Effectiveness in 2025 [https://www.appliedclinicaltrialsonline.com/view/five-predictions-rd-effectiveness-2025]
- 58. 8 Best Data Integrity Tools in 2025 [https://hevodata.com/learn/data-integrity-tools/]
- 59. How to Overcome Data Integrity Issues [https://www.fivetran.com/learn/data-integrity-issues]
- 60. Ten simple rules for computational biologists collaborating ... [https://pmc.ncbi.nlm.nih.gov/articles/PMC11189214/]
- 61. DBTL Cycle Advancement: Software Elevates Biotech R&D [https://teselagen.com/blog/revolutionizing-rd-dbtl-cycle/]
- 62. An engineering biology approach to automated workflow and ... [https://pmc.ncbi.nlm.nih.gov/articles/PMC11210394/]
- 63. Towards a fully automated algorithm driven platform for ... [https://www.nature.com/articles/s41467-019-13189-z]
- 64. Top Lab Exchange Platforms for Global Collaboration [https://www.scispot.com/blog/top-lab-exchange-platforms-for-global-collaboration]
- 65. Design-Build-Test-Learn Workflows - pySBOL's documentation! [https://pysbol2.readthedocs.io/en/latest/dbtl.html]
- 66. Hyper automation trends for 2025 [https://www.cloudcomputing-news.net/news/hyper-automation-trends-for-2025/]
- 67. Hyperautomation trends for 2025 | ConnectWise [https://www.connectwise.com/blog/hyperautomation-trends]
- 68. Hyperautomation Trends: The Future of Global Workflows [https://www.bitrix24.com/amp/articles/hyperautomation-trends-the-future-of-global-workflows.html]
- 69. How DataOps Is Revolutionizing Data Management [https://www.acceldata.io/blog/dataops-implementation-practical-guide-for-boosting-data-efficiency]
- 70. DataOps: Your Guide to Implementation [https://www.ascend.io/blog/dataops-transforming-the-way-we-handle-data]
- 71. DataOps Framework: 4 Key Components & How to ... [https://www.ibm.com/think/topics/dataops-framework]
- 72. Tips and Troubleshooting [https://docs.dataops.live/docs/guides/sole-fundamentals/troubleshooting/]
- 73. DataOps Best Practices: Enhancing Data Quality, ... [https://www.sprinkledata.com/blogs/dataops-best-practices-enhancing-data-quality-management-and-operations]
- 74. Embracing DataOps CI/CD for Enhanced Data ... [https://medium.com/@AmirKheirollah/embracing-dataops-ci-cd-for-enhanced-data-management-and-deployment-e4aa0648c647]
- 75. Ten quick tips for ensuring machine learning model validity [https://pmc.ncbi.nlm.nih.gov/articles/PMC11412509/]
- 76. A Step-by-Step Guide to Effective AI Model Validation [https://galileo.ai/blog/ai-model-validation]
- 77. FDA AI Guidance 2025: What Life Sciences Must Do Now [https://usdm.com/resources/blogs/fda-ai-guidance-2025-life-sciences-compliance]
- 78. What's new in the FDA's 2025 AI/ML draft guidance? [https://blogs.atlas-compliance.ai/whats-new-in-the-fdas-2025-ai-ml-draft-guidance/]
- 79. Evaluating transparency in AI/ML model characteristics for ... [https://www.nature.com/articles/s41746-025-02052-9]
- 80. AI Compliance Policy in the US: The 2025 Essential Guide [https://neuraltrust.ai/blog/ai-compliance-policy-us-2025-guide]
- 81. Proteomics Biomarker Discovery: A Quantitative Workflow ... [https://www.metwarebio.com/proteomics-biomarker-discovery-workflow/]
- 82. From Biomarker Discovery to Clinical Use [https://www.nordicbioscience.com/why-biomarkers/from-biomarker-discovery-to-clinical-use/]
- 83. Bridging the Gap: Translating Preclinical Biomarkers to ... [https://blog.crownbio.com/bridging-the-gap-translating-preclinical-biomarkers-to-clinical-success]
- 84. Ten quick tips for biomarker discovery and validation ... [https://pmc.ncbi.nlm.nih.gov/articles/PMC9371329/]
- 85. How Is Automation Transforming Biomarker Discovery? [https://www.genedata.com/resources/learn/details/blog/how-is-automation-transforming-biomarker-discovery]
- 86. Data Mesh vs Data Fabric: Which Architecture Is Right for Your ... [https://promethium.ai/guides/data-mesh-vs-data-fabric-comparison-guide/]
- 87. Network Automation Architecture: A Comprehensive Guide [https://netboxlabs.com/blog/network-automation-architecture/]
- 88. What is a Data Mesh? - Data Mesh Architecture Explained [https://aws.amazon.com/what-is/data-mesh/]
- 89. 10 benefits and challenges of data mesh [https://www.starburst.io/blog/10-benefits-challenges-data-mesh/]
- 90. Data Mesh vs Data Fabric: The Ultimate 2025 Comparison ... [https://medium.com/analysts-corner/data-mesh-vs-data-fabric-the-ultimate-2025-comparison-for-enterprise-architects-c69287b1ef07]
- 91. What is the GDPR? The Ultimate Guide to GDPR Compliance [https://www.iubenda.com/en/help/5428-gdpr-guide]
- 92. HIPAA vs. GDPR Compliance: What's the Difference? | Blog [https://www.onetrust.com/blog/hipaa-vs-gdpr-compliance/]
- 93. Common Problems with GDPR Compliance (& How to ... [https://www.itsasap.com/blog/problems-solutions-gdpr-compliance]
- 94. Top 10 HIPAA & GDPR Compliance Tools for IT & Data ... [https://www.cloudnuro.ai/blog/top-10-hipaa-gdpr-compliance-tools-for-it-data-governance-in-2025]
- 95. GDPR & HIPAA Compliance for Health Tech Companies ... [https://www.themomentum.ai/blog/hipaa-compliance-for-health-tech-companies-building-mvp]
- 96. HIPAA and GDPR: How to Comply in Medical Device Studies [https://www.greenlight.guru/blog/how-to-comply-with-hipaa-and-eu-gdpr-in-medical-device-studies]
- 97. Real-time AI performance: latency challenges and ... [https://mitrix.io/blog/real-time-ai-performance-latency-challenges-and-optimization/]
- 98. Just Trying “Stuff” Is Not A Real Experiment [https://www.lean.org/the-lean-post/articles/just-trying-stuff-is-not-a-real-experiment/]
- 99. Automated data processing and feature engineering for ... [https://www.sciencedirect.com/science/article/pii/S2949715924000027]
- 100. Comparative analysis of deep learning and traditional ... [https://www.nature.com/articles/s41598-025-16553-w]
- 101. Test Automation Challenges You Can't Ignore in 2025 [https://dev.to/satya_prakash/test-automation-challenges-you-cant-ignore-in-2025-2c8k]