Microfluidic High-Throughput Screening: Accelerating Synthetic Genetic Circuit Development
This article explores the transformative role of microfluidic high-throughput screening (HTS) in the development and optimization of synthetic genetic circuits.
Microfluidic High-Throughput Screening: Accelerating Synthetic Genetic Circuit Development
Abstract
This article explores the transformative role of microfluidic high-throughput screening (HTS) in the development and optimization of synthetic genetic circuits. Tailored for researchers, scientists, and drug development professionals, it provides a comprehensive overview from foundational principles to advanced applications. We delve into how droplet-based microfluidics enables the ultra-high-throughput analysis of thousands of genetic variants in picoliter volumes, dramatically accelerating design-build-test cycles. The content covers core methodologies, functional assays, and the integration of machine learning for data analysis and circuit optimization. Furthermore, it addresses key challenges in the field, presents validation strategies against traditional methods, and examines the promising clinical translation of intelligently controlled cell-based therapies, offering a vital resource for advancing biomedical research and therapeutic development.
Synthetic Biology Meets Microfluidics: Core Principles and Screening Imperatives
The Throughput Bottleneck in Traditional Genetic Circuit Characterization
The characterization of synthetic genetic circuits is a foundational process in synthetic biology, essential for prototyping metabolic pathways and developing novel therapeutics. Traditional methods, predominantly reliant on well-plate assays and manual liquid handling, impose a significant bottleneck on the entire design-build-test-learn (DBTL) cycle. These conventional approaches are characterized by low throughput, high reagent consumption, and logistical complexity, making the comprehensive screening of genetic designs a slow and resource-intensive endeavor [1] [2]. This bottleneck is particularly problematic given the context-dependent performance of genetic circuits, where their function is intricately linked to host cell physiology, resource competition, and growth feedback [3]. The inability to test circuits rapidly across a wide range of conditions hampers the development of robust, predictable biological systems. The emergence of automated microfluidic technologies represents a paradigm shift, offering a path to overcome these limitations by enabling high-throughput, cost-effective screening with high temporal resolution [1] [2].
Quantitative Comparison of Screening Methodologies
The limitations of traditional methods and the advantages of advanced microfluidic systems are quantitatively clear when comparing key operational parameters. The following table summarizes these differences, highlighting the dramatic improvements in throughput, cost, and experimental flexibility.
Table 1: Performance Comparison of Genetic Circuit Characterization Methods
| Parameter | Traditional Well-Plate assays | Microfluidic CFPU [1] | Droplet-based Screening (DropAI) [2] |
|---|---|---|---|
| Throughput (Number of Reactors) | 96 or 384 per plate | 280 individual chemostats | Millions of picoliter droplets |
| Reaction Volume | Microliters (µL) | Not Specified | Picoliters (pL) |
| Reagent Consumption | High | Low | Very Low (~12.5 µL for 50,000 tests) |
| Temporal Resolution | Low (Endpoint measurements) | High (Sustained steady-state) | High (Real-time monitoring possible) |
| Key Feature | Manual intervention, low replication | Programmable chemostats, pulse width modulation | Fluorescent color-coding, AI-driven prediction |
| Experimental Environment | Batch culture | Steady-state chemostat | Dynamic, combinatorial screening |
This quantitative comparison reveals that microfluidic platforms like the Cell-free Processing Unit (CFPU) and DropAI achieve orders-of-magnitude higher throughput while simultaneously reducing reagent consumption by several-fold [1] [2]. Furthermore, they provide a superior experimental environment, such as the sustained steady-state conditions in chemostats essential for analyzing dynamic circuit behaviors, which are nearly impossible to maintain in traditional batch cultures [1].
Detailed Experimental Protocols
Protocol 1: Traditional Well-Plate-Based Circuit Characterization
This protocol outlines the standard method for characterizing gene circuit performance in a 96-well plate format, a common but low-throughput approach.
- Step 1: Strain Cultivation. Inoculate lysogeny broth (LB) medium with the bacterial strain harboring the genetic circuit. Incubate overnight at 37°C with shaking.
- Step 2: Assay Setup. Dilute the overnight culture 1:100 into fresh LB medium with appropriate inducers. Dispense 200 µL of the diluted culture into each well of a sterile 96-well plate. Include controls (e.g., negative control without inducer, positive control with a known circuit).
- Step 3: Measurement. Place the plate in a plate reader. Measure the optical density (OD600) and fluorescence (e.g., GFP: excitation 485 nm, emission 520 nm) at regular intervals (e.g., every 10-30 minutes) over a period of 12-24 hours. Maintain a constant temperature (e.g., 37°C) with continuous shaking between readings.
- Step 4: Data Analysis. Normalize fluorescence measurements to OD600 to account for cell density. Plot growth curves and normalized circuit output over time. Calculate key metrics such as response time, dynamic range, and expression level.
Protocol 2: High-Throughput Screening Using a Microfluidic CFPU
This protocol details the operation of a Cell-free Processing Unit for high-throughput characterization under steady-state conditions [1].
- Step 1: Device Priming. Flush the microfluidic device (fabricated from polydimethylsiloxane, PDMS) with a biocompatible fluorinated oil to fill the channels and prevent air bubbles. Load the DNA circuits into the individual chemostat chambers.
- Step 2: Reagent Preparation. Prepare the cell-free transcription-translation (TX-TL) reaction mix. The core components include cellular extract, energy sources (e.g., ATP, GTP), amino acids, and necessary cofactors.
- Step 3: System Operation. Use a pressure-driven or syringe pump system to perfuse the TX-TL reagent mix through the 280 chemostats. Employ microfluidic pulse width modulation (PWM) to dynamically adjust the composition of the reagents supplied to each chemostat in real-time, creating distinct environmental conditions.
- Step 4: Monitoring & Data Acquisition. Incubate the device at a controlled temperature (e.g., 30-37°C). Monitor gene expression in real-time using time-lapse fluorescence microscopy. Acquire images of all chemostats at regular intervals (e.g., every 5-10 minutes) over several hours or days.
- Step 5: Image & Data Analysis. Use image analysis software (e.g., ImageJ, CellProfiler) to quantify fluorescence intensity in each chemostat over time. Analyze the data to determine circuit performance metrics under various steady-state conditions.
Protocol 3: AI-Driven Droplet Screening (DropAI) for Circuit Optimization
This protocol describes a cutting-edge method for ultra-high-throughput combinatorial screening of cell-free gene expression systems [2].
- Step 1: Microfluidic Library Construction. Prepare separate pools of satellite droplets, each containing a unique set of CFE components (e.g., energy sources, additives) labeled with distinct fluorescent colors and intensities (FluoreCode). Generate picoliter-sized droplets at a high frequency (~300 Hz) using a flow-focusing microfluidic device.
- Step 2: Droplet Merging and Encoding. Merge one carrier droplet (containing the CFE mixture and DNA template) with four satellite droplets at a micro-teeth structure to form a complete screening unit. The FluoreCode of the merged droplet identifies its specific combinatorial composition.
- Step 3: In-Droplet Incubation and Imaging. Incubate the emulsion to allow for cell-free gene expression (e.g., sfGFP). Image the entire droplet library in parallel using a multi-channel fluorescence microscope to read both the FluoreCode (composition) and the reporter signal (circuit output).
- Step 4: Machine Learning Model Training. Use the experimental data (FluoreCode vs. output) to train a machine learning model (e.g., random forest, neural network). The model learns to predict the contribution of each component to the overall yield.
- Step 5: In Silico Optimization and Validation. Use the trained model to explore a vast combinatorial space in silico and predict high-yield combinations that were not experimentally tested. Validate the top predicted formulations in vitro.
Workflow Visualization of High-Throughput Screening
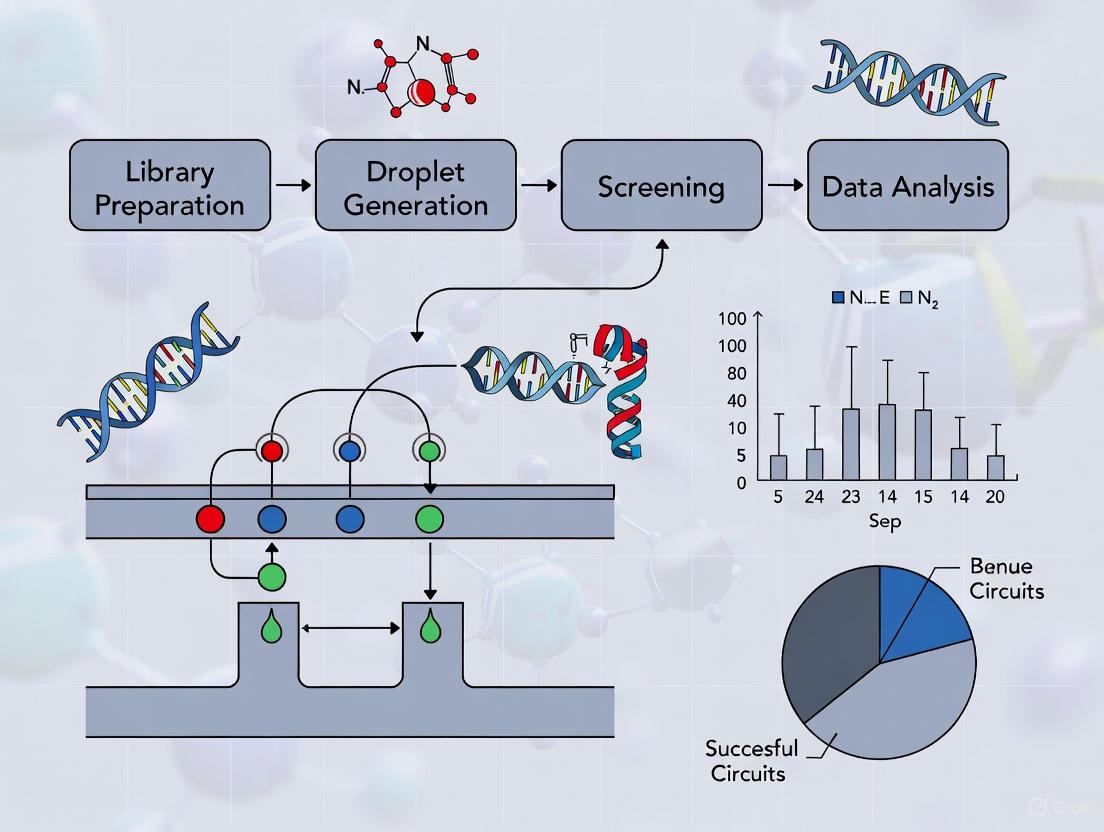
The following diagram illustrates the integrated experimental and computational workflow of the AI-driven droplet screening (DropAI) platform.
Diagram 1: AI-driven droplet screening workflow.
The Scientist's Toolkit: Key Research Reagent Solutions
Successful implementation of high-throughput genetic circuit characterization relies on a suite of specialized reagents and materials. The table below details essential solutions and their functions.
Table 2: Essential Research Reagents and Materials for High-Throughput Screening
| Reagent/Material | Function/Description | Application Example |
|---|---|---|
| Cell-Free Extract (E. coli, B. subtilis) | Crude cellular lysate providing the core transcriptional and translational machinery. | Serves as the foundational reaction environment in CFPU and DropAI systems [1] [2]. |
| Energy Regeneration System | Substrates (e.g., phosphoenolpyruvate) and enzymes that regenerate ATP from ADP. | Sustains long-term gene expression in cell-free systems and microfluidic chemostats [1]. |
| Fluorinated Oil & PEG-PFPE Surfactant | Oil phase and block-copolymer surfactant for stabilizing aqueous droplets in oil. | Prevents droplet coalescence in droplet-based microfluidics (DropAI) [2]. |
| Fluorescent Dyes (Encoding) | Non-interfering fluorescent markers used to label different component pools. | Creates the FluoreCode for tracing combinatorial conditions in droplet screens [2]. |
| Poloxamer 188 (P-188) | Non-ionic triblock-copolymer surfactant. | Enhances mechanical stability of emulsions in droplet-based assays [2]. |
| Polyethylene Glycol (PEG-6000) | A biocompatible macromolecular crowding agent. | Mimics the crowded intracellular environment and can stabilize droplets [2]. |
| Reporters (sfGFP, mCherry) | Genes encoding for easily measurable reporter proteins (e.g., fluorescent proteins). | Quantifies genetic circuit output in real-time during screening [1] [2]. |
| dNTPs and Amino Acids | Essential building blocks for DNA/RNA synthesis and protein translation. | Core components of any cell-free gene expression reaction mixture [1]. |
System Architecture of a Microfluidic Screening Platform
The core functionality of a microfluidic screening platform, such as the CFPU, depends on an integrated architecture that combines fluidic control and real-time monitoring.
Diagram 2: Microfluidic CFPU system architecture.
High-throughput screening (HTS) is indispensable in modern bioscience, particularly in the rapidly evolving field of synthetic genetic circuits. The integration of microfluidic technologies has fundamentally transformed HTS paradigms, enabling unprecedented efficiency and capability. Microfluidic HTS leverages precise fluid manipulation at the microscale to address critical limitations of conventional well-plate-based methods, which are often constrained by high reagent consumption, low speed, and limited parallelization [4]. For researchers engineering synthetic genetic circuits—such as oscillators, switches, and logic gates—these advancements facilitate more rapid and rigorous design-build-test-learn cycles [5]. This application note details the core advantages of microfluidic HTS—volume reduction, speed, and parallelization—within the context of synthetic genetic circuit research, providing structured quantitative data, detailed protocols, and essential workflow visualizations to guide implementation.
Core Advantages and Quantitative Benefits
The transition from traditional HTS methods to microfluidic platforms offers measurable and significant improvements across key operational parameters. These advantages are critical for screening synthetic genetic circuits, where the cost of reagents, the scale of variant libraries, and the need for dynamic environmental control are pressing concerns [4] [6].
Table 1: Quantitative Comparison of Microfluidic HTS vs. Conventional Methods
| Performance Parameter | Traditional HTS (96-/384-well) | Microfluidic HTS | Key Implications for Genetic Circuit Research |
|---|---|---|---|
| Assay Volume | Microliters (10-100 µL) | Nanoliters (nL) to Picoliters (pL) [4] | Enables screening of large circuit variant libraries with precious reagents; ideal for cell-free expression systems [7]. |
| Liquid Handling Speed | Minutes per plate (e.g., 384-well) | Seconds per plate (e.g., 10 nL across a 384-well plate in 20s) [6] | Drastically accelerates assay setup, freeing researcher time for data analysis and experimental design. |
| Degree of Parallelization | Hundreds to thousands of wells | Thousands to millions of droplets or chambers [4] | Permits unparalleled statistical depth, enabling single-cell analysis within a population of circuit-bearing cells [4]. |
| Reagent Cost Savings | Baseline | Up to 50% reduction via miniaturization [6] | Makes large-scale combinatorial screening of promoter/part combinations financially viable. |
| Dynamic Control | Low (static conditions) | High (precise temporal control of flows and gradients) [8] | Allows for real-time perturbation and analysis of circuit dynamics (e.g., induction kinetics, stability). |
The data in Table 1 underscores that microfluidic HTS is not merely an incremental improvement but a transformative approach. The nanoliter-scale volumes minimize the consumption of costly substrates and reagents for cell-free reactions or transfection mixes, which is paramount when testing thousands of genetic circuit variants [7] [6]. The exceptional speed and parallelization, often achieved through droplet-based microfluidics, transform a circuit characterization experiment from a multi-day, low-replication endeavor into a high-resolution, statistically powerful dataset acquired in hours [4]. Furthermore, the precise environmental control inherent to continuous-flow microfluidics allows researchers to subject circuits to complex, time-varying inputs, providing deeper insights into their performance and robustness under dynamic conditions that better mimic a native cellular environment [8] [5].
Application Protocols
The following protocols outline specific workflows for leveraging microfluidic HTS in synthetic genetic circuit development.
Protocol 1: High-Throughput Characterization of Circuit Variants Using Droplet Microfluidics
This protocol describes a workflow for encapsulating single cells expressing different genetic circuit variants into water-in-oil droplets to measure output heterogeneity and performance at a massive scale [4].
- Chip Priming: Flush the droplet generation microfluidic chip (e.g., PDMS-based) with a fluorinated oil containing 2-5% biocompatible surfactant to passivate the channels. Use syringe pumps for stable pressure-driven flow.
- Sample Preparation: Prepare an aqueous phase containing:
- A pooled library of engineered cells, each harboring a different genetic circuit variant, diluted to a concentration of ~10^6 cells/mL.
- A fluorescent reporter substrate (e.g., a fluorogenic compound for enzyme output) or a co-encapsulated lysis buffer if measuring intracellular components.
- Culture medium or buffer to maintain cell viability.
- Droplet Generation: Co-inject the aqueous sample phase and the oil-surfactant continuous phase into the droplet generator chip. Adjust flow rates to produce monodisperse droplets with a diameter of 20-50 µm, each ideally containing zero or one cell.
- Incubation & Imaging: Collect droplets in a capillary tube or off-chip reservoir. Incubate at the appropriate temperature for 2-6 hours to allow for gene expression. Mount the collection tube onto an automated fluorescence microscope for high-throughput imaging.
- Data Analysis: Use automated image analysis software to quantify the fluorescence intensity of thousands of individual droplets. Link fluorescence distributions to specific circuit variants via barcoding or subsequent sequencing.
Protocol 2: Real-Time Dynamic Analysis on a Perfusion Chip
This protocol utilizes a microfluidic chip with continuous perfusion for monitoring genetic circuit behavior in response to dynamically changing input signals [8] [5].
- Cell Loading and Seeding: Introduce a suspension of cells containing the synthetic genetic circuit of interest into the culture chambers of a commercially available or custom-fabricated perfusion chip (e.g., an organ-on-a-chip style device). Allow cells to adhere and equilibrate for several hours under a constant flow of fresh medium.
- Circuit Perturbation: Program a syringe or pressure pump to switch the perfusate from a basal medium to one containing a precise concentration of an inducer molecule (e.g., IPTG, aTc). Complex dynamic patterns, such as pulses or linear gradients, can be implemented.
- Real-Time Monitoring: Use time-lapse microscopy (e.g., phase-contrast and fluorescence) to monitor the cells continuously throughout the experiment. For transcriptional reporters, fluorescence intensity serves as a direct proxy for circuit output.
- Data Extraction and Modeling: Extract single-cell traces of fluorescence intensity over time. Analyze this data to determine key dynamic parameters of the circuit, such as activation delay, rise time, overshoot, and decay rate, to inform and refine mathematical models.
The logical flow of the experiment, from chip preparation to data-driven modeling, is visualized below.
Protocol 3: Cell-Free Screening of Genetic Circuit Components
This protocol leverages the miniaturization capabilities of microfluidics to screen genetic circuit parts rapidly in a cell-free transcription-translation (TX-TL) system [7].
- Reagent Preparation: Thaw an aliquot of cell-free TX-TL reaction mix on ice. In a separate tube, pre-mix the DNA templates encoding the genetic circuit components (e.g., promoter libraries, ribosome binding site variants) with a fluorescent reporter gene.
- Microfluidic Assay Setup: Using a non-contact liquid handler (e.g., I.DOT Liquid Handler) or an on-chip mixer, dispense nanoliter-scale droplets of the TX-TL mix containing the DNA template into the reaction chambers of a microfluidic chip [6].
- On-Chip Incubation and Detection: Seal the chip to prevent evaporation and place it in a controlled-temperature enclosure on a fluorescence plate reader or microscope. Monitor the fluorescence development over 4-8 hours.
- Analysis: Determine the kinetic parameters (e.g., maximum expression level, response time) for each reaction chamber. The high degree of parallelization allows for the simultaneous testing of hundreds of component combinations in a single run.
The Scientist's Toolkit: Essential Research Reagent Solutions
Successful implementation of microfluidic HTS relies on a suite of specialized reagents and materials. The following table details key solutions for research in this field.
Table 2: Essential Research Reagent Solutions for Microfluidic HTS of Genetic Circuits
| Item | Function/Description | Application Note |
|---|---|---|
| PDMS Chips | Flexible, gas-permeable, and optically transparent chips for cell culture and droplet generation [8] [4]. | Ideal for perfusion cultures and rapid prototyping of new device geometries due to ease of fabrication. |
| Fluorinated Oil & Surfactants | Forms the continuous phase in droplet-based assays, stabilizing droplets and preventing coalescence [4]. | Critical for maintaining droplet integrity during incubation and transport for single-cell encapsulation workflows. |
| Cell-Free TX-TL Systems | Reconstituted transcription-translation machinery from sources like E. coli for expressing genetic circuits without cells [7]. | Enables rapid, high-throughput part characterization in a well-controlled, host-factor-independent environment. |
| Nanoliter Dispensers | Automated liquid handlers (e.g., I.DOT) capable of non-contact dispensing of nL-pL volumes with high precision [6]. | Essential for assay miniaturization, reducing reagent costs, and setting up complex reactions in microtiter plates or chips. |
| Programmable Syringe Pumps | Provide precise, computer-controlled flow rates for continuous-flow microfluidic systems [8]. | Allows for the creation of complex, time-varying input signals for dynamic characterization of genetic circuits. |
Workflow Integration and Data Generation
A typical integrated workflow for screening synthetic genetic circuits using microfluidic HTS combines the aforementioned advantages and protocols into a cohesive pipeline. The process begins with the design of a circuit variant library, which could consist of thousands of combinations of promoters, coding sequences, and regulatory elements. This library is then cloned and prepared for screening. Depending on the experimental goal, the library is either introduced into a host cell line for single-cell analysis or used directly in a cell-free system.
The core of the workflow is the microfluidic HTS assay, which, via droplet encapsulation or microchamber loading, partitions the library into millions of parallel experiments. During this phase, the circuits are activated and their outputs measured, often via fluorescent reporters. The resulting high-content data is then processed and analyzed, linking circuit performance to specific DNA sequences. This rich dataset feeds back into the design cycle, informing the next generation of constructs and leading to an optimized, functional synthetic genetic circuit [5]. This iterative cycle is illustrated below.
Droplet Microfluidics as Picoliter Reaction Vessels for Single-Cell Analysis
Droplet microfluidics has emerged as a breakthrough technology that is revolutionizing high-throughput screening (HTS) for synthetic biology and single-cell analysis [9] [10]. This technology enables the encapsulation of individual cells within picoliter-to-nanoliter droplets, creating isolated microreactors ideal for analyzing cellular heterogeneity and screening synthetic genetic circuits [11]. Each droplet functions as a distinct experimental vessel, facilitating the investigation of cellular phenotypic variations, intercellular interactions, and genomic insights without cross-contamination [9] [10].
The integration of droplet microfluidics with synthetic biology is particularly valuable for screening cell-free gene expression (CFE) systems and synthetic genetic circuits. It overcomes the limitations of conventional methods by providing unprecedented throughput, minimal reagent consumption, and the ability to conduct millions of parallel experiments [1] [2]. Recent advancements combining droplet microfluidics with AI-driven screening strategies further enhance the optimization of complex biochemical systems, dramatically accelerating the design-build-test cycles essential for advanced genetic circuit development [2] [12].
Key Technological Foundations
Droplet Generation Mechanisms
Droplet generation in microfluidic devices relies on the interaction between immiscible phases, typically facilitated by specific channel architectures. The primary methods can be categorized as passive or active, with passive methods being predominant for high-throughput biological applications [11].
Table 1: Comparison of Passive Droplet Generation Geometries [11]
| Geometry | Typical Droplet Diameter | Generation Frequency | Key Advantages | Key Limitations | Primary Applications |
|---|---|---|---|---|---|
| Cross-flow (T-junction) | 5–180 μm | ~2 Hz | Simple structure, produces small, uniform droplets | Prone to clogging, high shear force | Chemical synthesis |
| Co-flow | 20–62.8 μm | 1,300–1,500 Hz | Low shear force, simple structure, low cost | Larger droplets, poor uniformity | Biomedical |
| Flow-Focusing | 5–65 μm | ~850 Hz | High precision, wide applicability, high frequency | Complex structure, difficult to control | Drug delivery |
| Step Emulsification | 38.2–110.3 μm | ~33 Hz | Simple structure, high monodispersity | Low frequency, droplet size hard to adjust | Single-cell analysis |
The formation of droplets is governed by the balance between viscous forces, inertial forces, and interfacial tension, characterized by dimensionless numbers such as the Capillary number (Ca) and Weber number (We) [12]. Recent innovations include 3D Micro-Cross structures that generate both water-in-oil (W/O) and oil-in-water (O/W) droplets without surface treatment, and micropillar arrays that sequentially split larger droplets into highly uniform smaller ones with a production rate of approximately 250 L/h/m² and a size variation reduced to 13% [10].
System Workflow Integration
A complete droplet microfluidics workflow for single-cell analysis involves several integrated steps: droplet generation, encapsulation, incubation, manipulation, and analysis. The following diagram illustrates the core workflow for single-cell analysis and its adaptation for cell-free genetic circuit screening.
Application Notes and Protocols
Protocol 1: High-Throughput Single-Cell Encapsulation and Screening
This protocol details the encapsulation of individual cells for the analysis of heterogeneity, such as variations in gene expression or drug response [9] [10].
Materials:
- Microfluidic Device: Flow-focusing or co-flow geometry chip.
- Continuous Phase: Fluorinated oil with 2-5% biocompatible PEG-PFPE surfactant.
- Dispersed Phase: Cell suspension in appropriate growth medium, adjusted to a density of 50,000–100,000 cells/mL to maximize single-cell encapsulation.
- Stabilizers: Poloxamer 188 (P-188, 0.1-1% w/v) and Polyethylene glycol 6000 (PEG-6000, 1-5% w/v) to enhance emulsion stability [2].
- Detection System: Microscope equipped with a high-speed camera for real-time monitoring.
Procedure:
- Device Priming: Flush the microfluidic channels with the continuous phase (fluorinated oil with surfactant) to remove air bubbles and ensure uniform wettability.
- Droplet Generation:
- Load the cell suspension (dispersed phase) and continuous phase into their respective syringes.
- Use syringe pumps to control flow rates precisely. For a typical flow-focusing device, set the continuous phase flow rate to 2000–5000 μL/h and the dispersed phase to 200–500 μL/h.
- Monitor droplet formation at the junction. Droplets should be uniform and contain either a single cell or be empty, with a generation frequency of up to 10,000 droplets per second [11].
- Collection and Incubation: Collect the generated droplets in a syringe or tubing and seal the outlet. Incubate at the appropriate temperature (e.g., 37°C for mammalian cells) for several hours to days, depending on the assay.
- On-Chip Detection and Sorting: After incubation, reinject the droplets into a sorting chip. Detect signals of interest (e.g., fluorescence from a reporter protein) and use dielectrophoresis or other active sorting methods to isolate droplets containing cells with the desired phenotype.
Troubleshooting:
- Low Single-Cell Encapsulation Efficiency: Optimize cell suspension density using Poisson statistics. Ensure the suspension is well-dissociated to prevent cell clumps.
- Droplet Coalescence: Increase surfactant concentration or add stabilizers like Poloxamer 188. Verify that the flow rates are stable.
- Channel Clogging: Filter all solutions before loading. Use a pre-filter on the dispersed phase inlet if necessary.
Protocol 2: AI-Driven Screening of Cell-Free Genetic Circuits
This protocol describes the use of droplet microfluidics for the high-throughput screening and optimization of cell-free gene expression (CFE) systems, which is directly applicable to prototyping synthetic genetic circuits [2].
Materials:
- Microfluidic Device: A device capable of generating and merging multiple droplet populations (e.g., one carrier and three satellite droplet pools) [2].
- CFE System: E. coli or B. subtilis cell extract, energy sources (e.g., ATP, phosphoenolpyruvate), amino acids, nucleotides, and salts.
- DNA Templates: Plasmid or linear DNA encoding the genetic circuit, often with a reporter gene like superfolder Green Fluorescent Protein (sfGFP).
- Fluorescent Dyes: A set of non-interfering fluorescent dyes for color-coding (FluoreCode) different reaction components.
Procedure:
- Combinatorial Library Construction:
- Generate a library of carrier droplets containing the core CFE mixture and DNA circuit variants.
- Simultaneously, generate satellite droplets from different inlet pools, each containing a unique set of CFE components (e.g., different energy sources or transcription factors). Encode each component type and its concentration with a specific fluorescent color and intensity (FluoreCode) [2].
- Merge one carrier droplet with three satellite droplets at a micro-teeth merging structure to create a complete screening unit with a unique combinatorial makeup.
- In-Droplet Incubation and Reaction: Collect the merged droplets and incubate at 30–37°C for 2–6 hours to allow for gene expression.
- High-Throughput Detection:
- Image the droplets using a multi-channel fluorescence detection system to read the FluoreCode (identifying the composition) and the output signal (e.g., sfGFP fluorescence indicating circuit activity).
- This process can screen over 1,000,000 combinations per hour [2].
- Data Analysis and Machine Learning:
- Correlate the FluoreCode of each droplet with its corresponding output signal.
- Use this dataset to train a machine learning model (e.g., using a Residual Block Network or Fourier-Enhanced Network) to predict the contribution of each component to the system's output [2] [12].
- The model can then predict high-performing genetic circuit configurations or CFE formulations, which are validated in subsequent rounds of experimentation.
Troubleshooting:
- Low Merging Efficiency: Ensure droplet synchronization by calibrating the flow rates and frequencies of the different droplet streams. Optimize the design of the merging structure.
- Poor FluoreCode Resolution: Titrate the concentrations of fluorescent dyes to ensure distinct intensity levels. Check for spectral overlap between dyes and adjust filter sets on the detector.
- Low CFE Yield in Droplets: Verify the freshness and quality of the cell extract. Include crowding agents like PEG-6000 in the CFE mixture to stabilize the emulsion and enhance reaction efficiency [2].
The Scientist's Toolkit: Essential Research Reagents and Materials
Table 2: Key Reagent Solutions for Droplet Microfluidics in Single-Cell and Cell-Free Applications
| Reagent/Material | Function | Example Specifications & Notes |
|---|---|---|
| PEG-PFPE Surfactant | Stabilizes droplets against coalescence in aqueous-in-oil emulsions. | Critical for long-term incubation; typically used at 2-5% (w/w) in fluorinated oil [2]. |
| Poloxamer 188 (P-188) | Non-ionic surfactant that enhances the mechanical stability of emulsions for biochemical assays. | Often added to the aqueous phase at 0.1-1% (w/v) to prevent droplet collapse [2]. |
| Fluorinated Oil (e.g., HFE-7500) | Serves as the continuous phase; immiscible with aqueous biological samples. | Biocompatible, oxygen-permeable, and readily available with compatible surfactants. |
| Cell-Free Extract (E. coli, B. subtilis) | Crude cellular extract providing the enzymatic machinery for transcription and translation. | The core component of CFE systems for expressing synthetic genetic circuits without living cells [1] [2]. |
| Fluorescent Reporter Plasmid (e.g., sfGFP) | DNA template encoding a easily detectable output protein for circuit activity screening. | sfGFP is a common, fast-folding variant; its fluorescence intensity is proportional to gene expression yield [2]. |
| Energy Regeneration System | Provides a sustained supply of ATP to power the CFE reactions. | Often includes phosphoenolpyruvate (PEP) or creatine phosphate with their respective kinases [2]. |
| Fluorescent Coding Dyes | A set of inert, non-overlapping fluorescent molecules for encoding droplet content (FluoreCode). | Allows for high-throughput deconvolution of massive combinatorial screens by tracing components [2]. |
Droplet microfluidics provides a robust and versatile platform for conducting high-throughput single-cell analysis and screening synthetic genetic circuits in picoliter reaction vessels. The integration of this technology with AI and machine learning, as demonstrated by the DropAI platform and data-driven optimization frameworks, marks a significant leap forward [2] [12]. These approaches not only streamline the optimization of complex biological systems but also dramatically reduce the time and cost associated with traditional methods. As the field evolves, the convergence of advanced microfluidic designs, sophisticated reagent formulations, and intelligent computational models will continue to expand the boundaries of synthetic biology and personalized medicine.
High-throughput screening (HTS) is a cornerstone of modern biotechnology and drug discovery, enabling the rapid evaluation of thousands to millions of chemical or biological compounds. The global HTS market, valued at approximately USD 27-32 billion in 2025, is projected to grow at a compound annual growth rate (CAGR) of 10.0-10.7% through 2035, underscoring its critical role in accelerating research and development [13] [14]. Within this broad field, screening workflows for synthetic genetic circuits represent a specialized and powerful application, allowing researchers to probe cellular reprogramming and complex biological computations.
This application note details a core HTS workflow—encapsulation, incubation, and sorting—specifically tailored for the analysis of synthetic genetic circuits using microfluidics. This integrated approach enables the functional testing of circuit designs with unprecedented speed and scale, bypassing the limitations of traditional, labor-intensive methods. By compartmentalizing reactions and cells into picoliter-volume droplets, it minimizes reagent use, reduces costs, and facilitates the analysis of complex biological systems in a controlled environment [2].
The screening of synthetic genetic circuits via microfluidics involves a sequence of precisely coordinated steps designed to maximize throughput and data quality. The entire process, from sample preparation to data analysis, is visualized in the following workflow diagram.
Figure 1: High-throughput screening workflow for synthetic genetic circuits, from encapsulation to hit validation.
Detailed Protocols
Protocol 1: Microfluidic Encapsulation of Genetic Circuits
This protocol describes the generation of picoliter-scale droplets to compartmentalize cell-free reactions or single cells harboring genetic circuits.
Experimental Materials
Table 1: Key Reagents and Equipment for Microfluidic Encapsulation
| Item | Function/Description | Example Specifications/Formats |
|---|---|---|
| Microfluidic Chip | Generates monodisperse water-in-oil droplets. | Flow-focusing or T-junction design [2]. |
| Oil Phase | Continuous phase for droplet formation and stability. | Fluorinated oil with 1-2% PEG-PFPE biocompatible surfactant [2]. |
| Aqueous Phase | Contains the biochemical reaction components. | Cell extract, DNA template, energy sources, amino acids, and fluorescent reporter genes [2]. |
| Stabilizers | Enhance emulsion stability during incubation. | Poloxamer 188 (P-188, 0.5-1% w/v) and Polyethylene glycol 6000 (PEG-6000) [2]. |
| Syringe Pumps | Provide precise, steady flow rates for both oil and aqueous phases. | Flow rates tuned for ~80 µm diameter droplets [2]. |
Step-by-Step Methodology
- Chip Priming: Flush the microfluidic device channels with the fluorinated oil-surfactant mixture to ensure a hydrophobic environment and prevent aqueous phase adhesion.
- Aqueous Phase Preparation: Prepare the cell-free gene expression (CFE) master mix on ice. For a system designed to express superfolder green fluorescent protein (sfGFP), the mix includes:
- E. coli or B. subtilis crude cell extract.
- DNA template encoding the genetic circuit and sfGFP reporter.
- Energy regeneration system (e.g., phosphoenolpyruvate).
- Amino acids, nucleotides, and cofactors.
- Additives like P-188 and PEG-6000 for emulsion stabilization [2].
- Droplet Generation: Load the aqueous phase and oil phase into separate syringes. Mount them on syringe pumps and connect to the microfluidic chip. Initiate flow, typically with the oil phase flow rate set 2-5 times higher than the aqueous phase to achieve stable droplet formation. Optimize pressures to generate droplets of approximately 80 µm in diameter (~250 pL volume) at a rate of several hundred Hz to 1,000,000 droplets per hour [2].
- Barcoding (Optional for Combinatorial Screening): For complex screens involving multiple circuit variants or conditions, implement a fluorescent color-coding system (FluoreCode). Merge the primary carrier droplet containing the CFE reaction with satellite droplets containing different components, each labeled with a unique fluorescent color and intensity. This encodes the composition of each droplet for later decoding [2].
- Collection: Collect the generated emulsion in a PCR tube or a microcentrifuge tube. Keep the emulsion on ice or proceed directly to incubation.
Protocol 2: Incubation for Circuit Expression and Readout
This protocol covers the incubation conditions to activate gene expression within droplets and generate a measurable signal.
Experimental Materials
Table 2: Key Reagents and Equipment for Incubation and Readout
| Item | Function/Description | Example Specifications/Formats |
|---|---|---|
| Thermal Cycler or Incubator | Provides controlled temperature for gene expression. | Set to 30-37°C for optimal cell-free transcription-translation [2]. |
| Dual-Fluorescence Reporter System | Reports on circuit function and cell viability/cytotoxicity. | EYFP (Enhanced Yellow Fluorescent Protein) for primary output; ECFP (Enhanced Cyan Fluorescent Protein) for constitutive viability control [15]. |
| Plate Reader or Microscope | Alternative for end-point fluorescence measurement if sorting is not required. | Capable of detecting EYFP and ECFP signals. |
Step-by-Step Methodology
- Temperature Activation: Transfer the tube containing the emulsion to a thermal cycler or incubator. Set the temperature to 30°C for B. subtilis systems or 37°C for E. coli-based CFE systems [2].
- Incubation Duration: Incubate for 2-8 hours to allow for sufficient transcription and translation of the genetic circuit and the fluorescent reporter protein.
- Signal Generation: During incubation, successful circuit function will lead to the expression of the output reporter (e.g., EYFP). A constitutively expressed second fluorescent protein (e.g., ECFP) serves as an internal control for droplet integrity and to monitor non-specific cytotoxicity [15].
- Hold: After incubation, samples can be stored at 4°C for a short period before sorting, typically for up to 24 hours.
Protocol 3: Fluorescence-Activated Droplet Sorting
This protocol details the identification and sorting of droplets based on the fluorescence signal resulting from successful genetic circuit operation.
Experimental Materials
- Flow Cytometer / FACS: Instrument capable of detecting droplet fluorescence and triggering sorting. Must be equipped with lasers and filters appropriate for EYFP (e.g., 488 nm laser, 530/30 nm filter) and ECFP (e.g., 405 nm laser, 450/50 nm filter) [15] [2].
- Sheath Fluid: Appropriate buffer for the instrument, often the same fluorinated oil used for encapsulation.
Step-by-Step Methodology
- Instrument Setup: Calibrate the droplet sorter using control emulsions: a negative control (no DNA template) and a positive control (DNA template for constitutive reporter expression).
- Gating Strategy: Create a two-dimensional plot of EYFP (circuit output) versus ECFP (viability control). Set a gate to select droplets that show high EYFP fluorescence but maintain normal ECFP levels, thus identifying hits with strong circuit activity and minimal cytotoxicity [15].
Figure 2: Gating logic for sorting droplets based on dual-fluorescence readouts, distinguishing active circuits from inactive or cytotoxic ones. - Sorting: Dilute the emulsion with additional oil if necessary to achieve an optimal event rate for the sorter. Run the sample and sort the droplets that fall within the predefined gate into a collection tube.
- Analysis: For barcoded screens, analyze the fluorescence intensities of the sorted population across all channels to decode the specific circuit combinations (FluoreCodes) that led to a successful hit [2].
- Validation: Break the emulsion of sorted droplets to recover the genetic material. Use this material for downstream validation, such as PCR amplification, sequencing, or re-transformation, to confirm the identity and function of the selected genetic circuits.
The Scientist's Toolkit
Table 3: Essential Research Reagent Solutions for Genetic Circuit Screening
| Category | Item | Critical Function in Workflow |
|---|---|---|
| Cellular & Molecular Tools | Designer Cells | Engineered cell lines (e.g., HEK293T, HeLa) stably transduced with synthetic gene circuits and dual-fluorescence reporters for consistent, physiologically relevant screening [15]. |
| Cell-Free TXTL Systems | Crude cellular extracts (e.g., from E. coli) that enable in vitro transcription and translation, bypassing cell walls and allowing direct control over the reaction environment [2]. | |
| Synthetic Transcription Factors (sTFs) | Engineered repressors and anti-repressors that form the core processing units of synthetic genetic circuits, enabling logical operations like Boolean logic gates [16]. | |
| Detection & Reporting | Dual-Fluorescence Reporters | A pair of fluorescent proteins (e.g., EYFP and ECFP) that simultaneously report on circuit output and cytotoxicity/viability, minimizing false positives [15]. |
| Fluorocode Barcoding System | A method using fluorescent colors and intensities to uniquely tag thousands of different combinatorial conditions within a single droplet pool, enabling deconvolution of complex screens [2]. | |
| Software & Data Analysis | Machine Learning (ML) Models | AI models trained on initial screening data to predict high-performance genetic circuit combinations or CFE formulations beyond the experimentally tested space, guiding subsequent design cycles [2]. |
| Algorithmic Enumeration Software | Computational tools that automatically generate the most compact (compressed) genetic circuit designs to implement a specific Boolean logic function, minimizing metabolic burden [16]. |
Technical Notes and Troubleshooting
- Emulsion Stability: If droplets coalesce during incubation, increase the concentration of stabilizers like Poloxamer 188. Ensure the PEG-PFPE surfactant is fresh and properly mixed into the oil phase [2].
- Low Signal-to-Noise Ratio: Optimize the ratio of genetic components within the circuit. For cell-based assays, titrate the levels of proteases (e.g., 3CLpro) and synthetic transcription factors to tune circuit sensitivity and dynamic range [15].
- AI-Driven Optimization: Leverage machine learning to overcome complex optimization challenges. For instance, the DropAI strategy uses initial screening data to train a model that can predict high-yield combinations of CFE components, dramatically simplifying the formulation and reducing costs [2].
Genetically encoded fluorescent biosensors are engineered molecular tools that transform specific biological signals into quantifiable fluorescent readouts, enabling the real-time monitoring of signaling dynamics in living systems [17]. These biosensors leverage the properties of fluorescent proteins (FPs) to report on a vast array of cellular activities, from second messenger dynamics and enzyme activities to protein-protein interactions. Their integration into synthetic genetic circuits allows researchers to move beyond static snapshots, facilitating the high-throughput screening of circuit function within live cells across spatial and temporal scales. The core principle involves a target-specific sensing domain coupled to a reporter FP, whose fluorescence properties (intensity, lifetime, or spectral shift) change in response to the target analyte or activity. This functionality makes them indispensable for optimizing complex biological systems, where they act as internal probes reporting on the performance of synthetic genetic designs in their native physiological context.
Key Biosensor Mechanisms and Quantitative Readouts
Biosensors transduce circuit activity into a fluorescent signal through several sophisticated mechanisms. The choice of mechanism dictates the imaging modality, experimental setup, and data analysis pipeline.
2.1. FRET-Based Biosensors Förster Resonance Energy Transfer (FRET)-based biosensors rely on the non-radiative transfer of energy from a donor FP to an acceptor FP. This transfer is exquisitely sensitive to the distance (typically 1-10 nm) and orientation between the two FPs [17]. A classic application is monitoring conformational changes, as demonstrated by a recently developed PTEN biosensor. This sensor is designed such that the N and C termini of PTEN, labeled with a donor (mEGFP) and a dark acceptor (sREACh), move closer together or further apart depending on PTEN's activity state, thereby changing FRET efficiency [18]. The readout for FRET is most robustly measured using Fluorescence Lifetime Imaging Microscopy (FLIM), which quantifies the decrease in the donor's fluorescence lifetime upon energy transfer to the acceptor. This method is less sensitive to fluctuations in sensor concentration and laser intensity than intensity-based measurements [18].
2.2. Single FP Biosensors These biosensors utilize a single FP whose fluorescence is modulated by the insertion of a sensing domain that alters the chromophore environment. A prominent example is the GCaMP family of calcium indicators. While not detailed in the provided sources, the principle involves circular permutation of the FP and fusion to a calmodulin domain, where calcium binding induces a conformational change that enhances fluorescence. These sensors are simpler to use than FRET-based probes but may offer a more limited dynamic range for some applications.
2.3. Translocation and Polymerization Sensors Some biosensors do not change their fluorescence properties but instead alter their subcellular localization. For instance, a biosensor for a kinase activity might be engineered to translocate from the cytoplasm to the plasma membrane upon activation. The readout is the ratio of fluorescence in the target compartment versus the cytoplasm, quantified through time-lapse imaging.
Table 1: Comparison of Key Biosensor Mechanisms and Modalities
| Mechanism | Key Components | Primary Readout | Advantages | Limitations |
|---|---|---|---|---|
| FRET/FLIM [18] [17] | Donor FP, Acceptor FP, Sensing Domain | Donor Fluorescence Lifetime | Ratiometric; Robust in intact tissues; Insensitive to expression level | Requires specialized FLIM equipment; Lower signal-to-noise |
| Intensity-Based (Single FP) | Single circularly-permuted FP, Sensing Domain | Fluorescence Intensity | Simple imaging requirements; High signal-to-noise | Sensitive to expression level and focus drift |
| Translocation | FP fused to localization domain | Fluorescence Distribution Ratio | Does not require sensor engineering; Direct spatial readout | Requires high-resolution imaging; Complex analysis |
Application Note: High-Throughput Screening with Microfluidic Droplets
The integration of biosensors with microfluidic droplet systems represents a paradigm shift for the high-throughput screening of synthetic genetic circuits. The DropAI platform exemplifies this powerful combination [2].
3.1. Experimental Objective To optimize a cell-free gene expression (CFE) system for a synthetic circuit encoding a superfolder green fluorescent protein (sfGFP) by screening massive combinatorial libraries of CFE components with high throughput and minimal reagent consumption.
3.2. Workflow Overview The DropAI strategy involves two main phases: in-droplet experimental screening and in silico AI-driven optimization.
3.3. Detailed Protocol: DropAI for CFE Optimization
Step 1: Microfluidic Library Construction
- Microfluidic Device Operation: Utilize a PDMS-based microfluidic device designed to generate and merge picoliter-scale droplets at a rate of approximately 300 Hz [2].
- Droplet Generation: Create a stream of "carrier droplets" (~70 μm diameter) containing the basic CFE mixture (E. coli lysate, energy substrates, salts) and the synthetic genetic circuit template (e.g., plasmid encoding sfGFP). In parallel, generate multiple streams of "satellite droplets" (~36 μm diameter), each containing a unique library of CFE components (e.g., different energy sources, cofactors, tRNA mixtures) [2].
- Droplet Merging and Encoding: As carrier droplets flow downstream, synchronize them to merge with three satellite droplets. The resulting merged droplet is a complete reaction vessel. Each satellite droplet is pre-labeled with a unique fluorescent color and intensity (a "FluoreCode"), allowing the precise composition of every merged droplet to be traced via multi-channel fluorescence imaging post-assay [2].
Step 2: In-Droplet Incubation and Screening
- Incubation: Collect the emulsions and incubate at a defined temperature (e.g., 30-37°C) for several hours to allow for cell-free transcription and translation.
- High-Throughput Imaging: After incubation, flow the droplets through an imaging chamber or use a static imaging setup. Acquire fluorescence images in multiple channels:
- sfGFP Channel: To quantify the output of the synthetic circuit (sfGFP yield).
- FluoreCode Channels: To decode the specific combination of components present in each droplet.
- Data Extraction: Use image analysis software to extract, for each droplet, the sfGFP fluorescence intensity (circuit performance) and its associated FluoreCode (condition identity).
Step 3: In Silico Analysis and Prediction
- Machine Learning Training: Compile the data from all screened droplets (e.g., 50,000 droplets screening 500 conditions with 100 replicates) into a dataset. Use this dataset to train a machine learning model (e.g., random forest or neural network) to learn the non-linear relationships between CFE component combinations and sfGFP yield [2].
- Predictive Optimization: The trained model can then predict the performance of thousands of untested combinations in silico. Identify the top predicted high-yield formulations for experimental validation.
- Validation and Transfer Learning: Test the AI-predicted formulations in a standard benchtop CFE reaction. The DropAI platform demonstrated a 1.9-fold increase in sfGFP yield and a 2.1-fold reduction in unit cost [2]. Furthermore, the model trained on E. coli data can be adapted via transfer learning to optimize a Bacillus subtilis-based CFE system with minimal new experimental data.
Table 2: Quantitative Outcomes from DropAI Screening of a Cell-Free System [2]
| Parameter | Original CFE Formulation | DropAI-Optimized Formulation | Improvement Factor |
|---|---|---|---|
| Number of Additives | ~40 components | 3 essential additives | 4-fold reduction |
| sfGFP Yield | Baseline | 1.9x higher | 1.9-fold increase |
| Unit Cost | Baseline | 2.1x lower | 2.1-fold decrease |
| Screening Throughput | ~60,000 pipetting steps | ~1,000,000 combinations/hour | Highly efficient |
The Scientist's Toolkit: Essential Research Reagents and Materials
Table 3: Key Reagent Solutions for Biosensor and Microfluidics Applications
| Reagent / Material | Function / Description | Example Application |
|---|---|---|
| Genetically Encoded Biosensor [18] [17] | Engineered protein that changes fluorescence in response to a specific target (e.g., PTEN conformation). The core tool for linking biology to light. | PTEN FRET-FLIM biosensor for monitoring phosphatase activity in live neurons [18]. |
| Cell Extract (Lysate) [2] | Crude cytoplasmic extract providing the transcriptional and translational machinery for cell-free systems. The chassis for in vitro circuit testing. | E. coli or B. subtilis extract for cell-free gene expression in droplet screens [2]. |
| Fluorescent Proteins (FPs) [17] | Reporter proteins (e.g., mEGFP, sREACh) used as FRET pairs or direct reporters. The source of the fluorescent signal. | mEGFP as a FRET donor in the PTEN biosensor; sfGFP as a circuit output reporter [18] [2]. |
| Microfluidic Surfactant [2] | Biocompatible surfactant (e.g., PEG-PFPE) dissolved in fluorinated oil to stabilize emulsion droplets and prevent fusion. | PEG-PFPE surfactant for stabilizing picoliter CFE reaction droplets [2]. |
| Polymer Stabilizers [2] | Additives like Poloxamer 188 (P-188) and PEG-6000 to enhance the mechanical stability of emulsions for long-term incubation. | P-188 and PEG-6000 added to the CFE aqueous phase to prevent droplet collapse [2]. |
Signaling Pathway Visualization: From Circuit Activity to Biosensor Readout
The following diagram illustrates a generalized signaling pathway where the activity of a synthetic genetic circuit is coupled to the readout of a FRET-based biosensor. This encapsulates principles from both the PTEN activity sensing [18] and the CFE reporting [2] examples.
Implementing Droplet Screening: Workflows, Assays, and Real-World Applications
Droplet-based microfluidics has emerged as a foundational technology for high-throughput screening, enabling the rapid analysis of thousands of reactions in picoliter-volume compartments. For synthetic biology and genetic circuit research, this platform provides an isolated microenvironment for characterizing circuit behavior without cellular cross-talk [19] [2]. The two most prevalent passive methods for generating these microreactors are T-junction and flow-focusing geometries, each with distinct operational principles and performance characteristics. The selection between these geometries directly impacts experimental outcomes in screening throughput, reagent consumption, and data quality [19] [11]. This application note provides a structured comparison of T-junction and flow-focusing droplet generators, with specific protocols and implementation guidelines optimized for high-throughput screening of synthetic genetic circuits.
Geometrical Configurations and Working Principles
T-Junction Geometry
The T-junction configuration, first demonstrated for microfluidic applications by Thorsen et al., features a simple design where the dispersed phase channel intersects perpendicularly with the continuous phase channel [19]. In conventional operation, the aqueous phase enters from the side channel while the continuous oil phase flows through the main channel, with the emerging droplet being sheared off by the advancing continuous phase [20]. Recently, an alternative configuration has been proposed where the continuous oil phase is introduced through the side channel, enabling precise pressure-driven "cutting" of the aqueous stream for improved on-demand control [20].
Droplet formation in T-junctions is governed by the interplay between viscous shear forces from the continuous phase and interfacial tension at the fluid interface. At low capillary numbers, the mechanism follows a squeezing regime where the dispersed phase temporarily blocks the main channel, building upstream pressure until a droplet pinches off [19] [20]. This produces highly monodisperse droplets with sizes primarily determined by the channel dimensions and flow rate ratios [19].
Flow-Focusing Geometry
In flow-focusing geometry, the dispersed phase flows through a central channel while the continuous phase is introduced through two side channels that symmetrically surround the dispersed phase [19] [21]. All three streams are then hydrodynamically focused through a narrow constriction, where the converging flows accelerate and thin the dispersed phase into a ligament that breaks into droplets [19] [22].
The flow-focusing mechanism creates stronger shear forces than T-junctions, enabling higher droplet generation frequencies up to kHz ranges [19]. Two distinct operational regimes are observed: dripping mode, which produces highly monodisperse droplets immediately at the constriction; and jetting mode, where the dispersed phase extends as a thread that breaks up further downstream, resulting in less uniform droplets [19]. The transition between these regimes is controlled by the capillary number and flow rate ratio [19].
Performance Comparison and Selection Criteria
Table 1: Quantitative comparison of T-junction and Flow-focusing geometries for droplet generation
| Parameter | T-Junction | Flow-Focusing | Implications for Genetic Circuit Screening |
|---|---|---|---|
| Droplet Size Range | 5-180 μm [11] | 5-65 μm [11] | Flow-focusing enables smaller reactors for higher throughput |
| Generation Frequency | ~2 Hz [11] | ~850 Hz [11] to kHz [19] | Flow-focusing offers significantly higher throughput |
| Droplet Monodispersity | High (Polydispersity <2%) [20] | Very High (Polydispersity 0.19-1.74%) [21] | Both suitable for quantitative screening |
| Size Control Mechanism | Flow rate ratio [19] | Flow rate ratio & constriction geometry [19] [22] | Flow-focusing offers more control parameters |
| Operational Regimes | Squeezing, Dripping, Jetting [19] | Dripping, Jetting [19] | T-junction squeezing regime provides active size control |
| Typical Capillary Number (Ca) | Low Ca (<0.01) [20] | Wider range (0.001-0.05) [23] | Flow-focusing more adaptable to different fluid properties |
| Geometry Complexity | Simple [11] | Complex [11] | T-junction easier to fabricate |
| Clogging Susceptibility | Prone to clogging [11] | Less prone [22] | Flow-focusing more robust for long experiments |
Table 2: Selection guide based on application requirements
| Application Requirement | Recommended Geometry | Rationale |
|---|---|---|
| High-throughput screening | Flow-focusing | Higher generation frequency (~850 Hz vs ~2 Hz) [11] |
| Minimal reagent consumption | Flow-focusing | Smaller droplet sizes (down to 5μm) [11] |
| Rapid prototyping | T-junction | Simpler design and fabrication [11] |
| On-demand droplet generation | T-junction (modified) | Better pressure control for individual droplet formation [20] |
| High-viscosity fluids | Flow-focusing | Better performance with wider viscosity ranges [22] |
| Budget-constrained projects | T-junction | Lower fabrication cost and complexity [11] |
Experimental Protocols
Protocol 1: T-Junction Droplet Generation for Cell-Free Reactions
This protocol describes droplet generation using a T-junction geometry, optimized for compartmentalizing cell-free gene expression (CFE) reactions for synthetic genetic circuit characterization [20] [2].
Materials and Reagents
Table 3: Essential research reagents and materials
| Item | Specification | Function |
|---|---|---|
| Microfluidic Chip | PDMS-based T-junction [24] | Droplet generation platform |
| Pressure Controller | High-precision pneumatic system (e.g., Fluigent, Elveflow) [20] [21] | Pulse-free pressure delivery |
| Continuous Phase | Fluorinated oil with 2-5% PEG-PFPE surfactant [2] | Carrier fluid for droplets |
| Dispersed Phase | CFE reaction mixture with DNA template [2] | Synthetic genetic circuit solution |
| Surface Treatment | Aquapel for hydrophobic coating [24] | Prevents aqueous phase wetting |
| Stabilizers | Poloxamer 188, PEG-6000 [2] | Enhance emulsion stability |
Procedure
Chip Preparation: Treat the PDMS T-junction chip with Aquapel to create a hydrophobic surface, ensuring proper wetting of the continuous oil phase [24]. Flush channels with fluorinated oil to prime the system.
Pressure System Setup: Connect the continuous phase (fluorinated oil with 2% surfactant) and dispersed phase (CFE reaction mixture) reservoirs to the pressure controller. Ensure all tubing is properly purged of air bubbles [21].
Initial Pressure Calibration:
- Set continuous phase pressure (Pc) to 150 mbar
- Set dispersed phase pressure (Pd) to 50 mbar
- Monitor droplet formation under microscope [20]
Droplet Generation Optimization:
Collection and Incubation: Collect droplets in a downstream reservoir or directly into tubing for incubation at 25-30°C for CFE reaction development [2].
Quality Control: Use automated droplet measurement software (e.g., ADM) to analyze droplet size distribution and polydispersity [21]. Accept batches with coefficient of variation <2% for screening applications.
Protocol 2: Flow-Focusing Droplet Generation for High-Throughput Screening
This protocol leverages flow-focusing geometry for high-frequency droplet generation, suitable for large-scale combinatorial screening of genetic circuit variants [2] [21].
Materials and Reagents
Table 4: Specialized reagents for high-throughput flow-focusing
| Item | Specification | Function |
|---|---|---|
| Flow-Focusing Chip | PDMS or glass with 10-50 μm constriction [22] | High-frequency droplet generation |
| Viscosity Modifier | Glycerol or PEG [22] | Adjusts dispersed phase viscosity |
| Fluorescent Reporters | sfGFP, mCherry DNA templates [2] | Genetic circuit output measurement |
| Stabilization Additives | Poloxamer 188 (0.1-1%) [2] | Prevents droplet coalescence |
| Multi-channel Imaging | Fluorescence microscope with CCD camera [2] | Parallel droplet analysis |
Procedure
Chip Design and Fabrication: Utilize a flow-focusing geometry with constriction width 1.5-2× the target droplet diameter. Ensure symmetrical channel design for uniform focusing [22].
System Priming:
- Load continuous phase reservoir with fluorinated oil containing 3-5% PEG-PFPE surfactant
- Prime all channels to remove air bubbles
- Equilibrate pressure system to ensure stable baseline [21]
Flow Rate Optimization:
Droplet Generation and Collection:
- Monitor droplet formation at the constriction region
- Ensure operation in dripping regime for maximum monodispersity
- Collect droplets in temperature-controlled reservoir for incubation [2]
High-Throughput Operation:
Validation and Analysis:
- Sample droplets for size measurement using automated analysis
- Verify generation frequency and stability over time (≥30 minutes)
- Confirm coefficient of variation <1% for screening applications [21]
Applications in Genetic Circuit Screening
Case Study: AI-Driven Screening with DropAI
The DropAI platform demonstrates the power of flow-focusing droplet generation for high-throughput optimization of cell-free gene expression systems. By generating picoliter droplets at approximately 300 Hz, this approach enabled screening of 6,561 combinatorial conditions with minimal reagent consumption [2]. Each droplet served as an independent microreactor containing CFE components, with fluorescent color-coding used to trace composition. Machine learning analysis of the screening data identified optimized CFE formulations, reducing unit cost of expressed protein fourfold while doubling yield [2].
Implementation Workflow for Circuit Characterization
Troubleshooting and Optimization
Common Challenges and Solutions
Table 5: Troubleshooting guide for droplet generation systems
| Problem | Potential Causes | Solutions |
|---|---|---|
| Unstable droplet generation | Pressure fluctuations, surfactant depletion | Use pressure controllers instead of syringe pumps [24], refresh surfactant solution |
| Droplet coalescence | Insufficient surfactant, high droplet density | Increase surfactant concentration (2-5%), add stabilizers like Poloxamer 188 [2] |
| Channel wetting | Incorrect surface treatment | Ensure hydrophobic treatment for water-in-oil droplets [24] |
| Low generation frequency | Suboptimal pressure/flow ratios, channel geometry | Adjust flow rate ratio (Qd/Qc=0.1-0.5), optimize constriction design [21] [22] |
| High polydispersity | Improper operation regime, pulsatile flows | Operate in squeezing (T-junction) or dripping (flow-focusing) regime [19] [20] |
| Clogging | Particulate matter, precipitate formation | Filter solutions (0.22 μm), include additives to prevent aggregation [24] |
Advanced Optimization Strategies
For high-precision applications, implement real-time monitoring with high-speed cameras and automated droplet measurement software [21] [24]. For T-junctions, utilize the modified configuration with oil in the side channel for enhanced on-demand control [20]. For flow-focusing devices, consider asymmetric designs to enhance mixing during droplet formation [11]. Computational fluid dynamics (CFD) modeling can predict optimal geometries and operating conditions before fabrication, reducing development time [23] [22].
Both T-junction and flow-focusing geometries offer distinct advantages for droplet-based screening of synthetic genetic circuits. T-junctions provide simplicity, ease of fabrication, and excellent on-demand control, making them ideal for lower-throughput applications and protocol development. Flow-focusing geometries enable higher throughput and smaller droplet sizes, advantageous for large-scale combinatorial screening with limited reagents. The selection between these geometries should be guided by specific application requirements including throughput needs, droplet size specifications, and available resources. When implemented with the protocols described herein, both platforms can significantly accelerate the design-build-test cycles for synthetic genetic circuit development.
High-throughput screening (HTS) is indispensable for advancing synthetic biology and drug development, enabling the rapid evaluation of vast genetic libraries. Traditional methods, however, are often constrained by volume, cost, and throughput. Droplet microfluidics has emerged as a transformative technology, overcoming these limitations by compartmentalizing reactions in picoliter volumes, allowing for ultrahigh-throughput screening exceeding thousands of samples per second [25]. This application note details how functional assays—specifically reporter expression, binding interactions, and metabolic output—are leveraged within droplet-based systems to accelerate the design-build-test cycles of synthetic genetic circuits. We provide structured experimental data, standardized protocols, and visual workflows to facilitate the adoption of these methods in research and development.
Functional assays provide a direct readout of biological activity, making them crucial for evaluating the performance of synthetic genetic circuits beyond mere expression levels. The table below summarizes the core functional assays applicable to droplet-based screening.
Table 1: Core Functional Assays for Droplet-Based Screening
| Assay Type | Measured Output | Example Sensor/Reporter | Screening Readout | Primary Application |
|---|---|---|---|---|
| Reporter Expression | Transcriptional/Translational activity | Fluorescent proteins (e.g., sfGFP) [2] | Fluorescence intensity | Circuit output level, Promoter strength |
| Binding Interactions | Protein-protein, Ligand-receptor interactions | FRET-based biosensors, Split-protein systems | Fluorescence co-localization or transfer | Protein engineering, Affinity quantification |
| Metabolic Output | Metabolite concentration, Small molecule production | Genetically-encoded metabolic sensors (e.g., based on PPARα-SRC-1 interaction) [26] | Fluorescence/Luminescence intensity | Metabolic pathway prototyping, Enzyme evolution |
Research Reagent Solutions
The successful implementation of droplet-based functional assays relies on a specialized toolkit of reagents and materials. The following table catalogues the essential components.
Table 2: Essential Research Reagents for Droplet-Based Functional Assays
| Reagent / Material | Function | Specific Examples & Notes |
|---|---|---|
| Genome-wide CRISPR Library | Enables systematic genetic perturbation of sender cells [27]. | ~80,000 gRNA libraries for three to four gRNA coverage per gene. |
| Fluorescent Reporter Circuit | Reports on activation of a specific pathway or circuit in receiver cells [27] [26]. | NF-κB activation reporter [27]; PPARα-SRC-1 based fatty acid sensor [26]. |
| Cell-Free Gene Expression (CFE) System | Provides transcription/translation machinery in vitro for rapid prototyping [2]. | E. coli or Bacillus subtilis crude extracts, supplemented with energy sources and nucleotides. |
| Microfluidic Surfactant | Stabilizes water-in-oil emulsions to prevent droplet coalescence during incubation and handling [25]. | PEG-PFPE surfactant, often supplemented with polymers like Poloxamer 188 for enhanced stability [2]. |
| Fluorescent Dye Tracers | Facilitates droplet composition encoding and tracking during combinatorial screening [2]. | Used in "FluoreCode" systems to encode thousands of unique combinations via color and intensity. |
Experimental Workflows & Protocols
Workflow 1: Screening Cell-Cell Interaction Regulators via SPEAC-seq
This protocol is adapted from the SPEAC-seq (Systematic Perturbation of Encapsulated Associated Cells followed by sequencing) method for discovering functional regulators of intercellular communication using genome-wide CRISPR screening [27].
Detailed Protocol
- Device Fabrication: Fabricate two polydimethylsiloxane (PDMS) microfluidic devices using soft lithography: one for droplet co-encapsulation and another for fluorescence-activated droplet sorting (FADS) [27].
- Cell Preparation:
- Sender Cells (CRISPR-perturbed): Transduce your population of sender cells (e.g., microglia) with a lentiviral genome-wide CRISPR-Cas9 library (e.g., ~80,000 gRNAs). Culture for at least 7 days under appropriate selection to ensure stable transduction and expression of gRNAs [27].
- Receiver Cells (Reporter): Establish a stable cell line (e.g., astrocytes) containing a fluorescent reporter circuit for the pathway of interest (e.g., NF-κB activation). Pre-stimulate these cells with a sub-activating dose of cytokine if required by your experimental design [27].
- Droplet Co-encapsulation:
- Stain each cell population with a distinct fluorescent cell tracker dye to facilitate the identification of one-to-one pairing during analysis.
- Use the first PDMS device to co-encapsulate single sender and single receiver cells into picoliter-scale droplets using a biocompatible oil phase containing 1-2% PEG-PFPE surfactant [27] [25].
- Collect the emulsion and incubate for 4-24 hours to allow for cell-cell interactions and subsequent reporter activation.
- Droplet Sorting and Analysis:
- Reinject the emulsion into the second microfluidic device integrated with a FADS system.
- Sort droplets based on the fluorescence signal from the activated reporter in the receiver cells. Collect droplets exhibiting high fluorescence (activated) and, for comparison, a set of droplets with low fluorescence (non-activated) [27].
- Break the sorted droplets, lyse the cells, and recover the gDNA.
- Amplify the gRNA sequences from the gDNA using PCR with primers containing Illumina adapter sequences.
- Perform next-generation sequencing (NGS) on the amplified gRNA libraries.
- Data Analysis: Compare the frequency of each gRNA in the activated droplet population versus the non-activated control population to identify genetically perturbed sender cells that potently regulated the receiver cell's response.
Workflow 2: Optimizing Cell-Free Gene Expression with DropAI
This protocol outlines the DropAI strategy, which combines high-throughput droplet microfluidics with machine learning to optimize complex biochemical systems like Cell-Free Gene Expression (CFE) [2].
Detailed Protocol
- Combinatorial Library Generation:
- Prepare a master mix containing the CFE system fundamentals: crude E. coli extract, DNA template encoding superfolder GFP (sfGFP), and necessary salts.
- Use a specialized microfluidic device to generate a library of carrier droplets containing this master mix.
- Simultaneously, generate satellite droplets containing different combinations and concentrations of CFE additives (e.g., energy sources, cofactors, nucleotides). Each additive or concentration level is tagged with a unique fluorescent color and intensity, creating a "FluoreCode" [2].
- Merge one carrier droplet with multiple satellite droplets in a deterministic manner to create a final droplet containing a unique combinatorial condition, identifiable by its composite FluoreCode.
- In-Droplet Screening:
- Incubate the emulsion at 30°C for several hours to allow for sfGFP expression.
- Flow the droplets through an imaging chamber and capture high-speed, multi-channel fluorescence images to read both the FluoreCode (identifying the condition) and the resulting sfGFP signal (the functional output) [2].
- In Silico Optimization & Validation:
- Process the imaging data to correlate each FluoreCode with its corresponding sfGFP yield.
- Use this dataset to train a machine learning model (e.g., linear regression, random forest) to predict CFE yield based on component composition.
- The model is used to explore the vast combinatorial space in silico and predict high-performing, simplified CFE formulations that were not directly tested.
- Validate the top-predicted formulations in a bulk CFE reaction. The DropAI method has achieved a fourfold reduction in unit cost and a 1.9-fold increase in sfGFP yield [2].
The performance of droplet-based functional assays is characterized by high throughput, minimal reagent consumption, and robust quantitative output. The following table consolidates key metrics from the cited applications.
Table 3: Performance Metrics of Droplet-Based Functional Assays
| Screening Platform | Throughput | Droplet Volume | Reagent Consumption per Test | Key Performance Outcome |
|---|---|---|---|---|
| SPEAC-seq [27] | Genome-wide (e.g., ~80,000 gRNAs) in <2 weeks | Picoliter | Nanograms of library DNA | Identified thousands of microglial regulators of astrocyte inflammation. |
| DropAI (CFE) [2] | ~1,000,000 combinations/hour | ~250 pL | ~12.5 µL total reagent for 50,000 tests | 2.1-fold decrease in unit cost; 1.9-fold increase in sfGFP yield. |
| Fatty Acid Sensor [26] | Amenable to high-throughput analysis | Not Specified | Not Specified | Real-time detection of fatty acid trafficking dynamics (minute-scale). |
| General HTS [25] | >10³ samples/day (HTS); >10⁵/day (UltraHTS) | Femtoliters to Nanoliters | 10³–10⁶ fold volume reduction vs. bulk | Enables screening at rates orders of magnitude faster than robotic handling. |
Within the broader context of high-throughput screening for synthetic genetic circuits, the initial encapsulation of biological components into droplets is merely the first step. To execute complex multi-step biochemical assays, such as those required to study combinatorial chromatin-based transcriptional regulation [28], researchers must precisely add reagents to droplets after they have been formed. Post-encapsulation manipulation addresses this need, enabling the sequential addition of inducers, substrates, or lysis buffers to initiate and control reactions within picoliter-volume reactors. Two primary techniques facilitate this crucial function: picoinjection and droplet merging. This application note provides a detailed comparison of these methods, along with standardized protocols for their implementation in microfluidic workflows, focusing on robustness, throughput, and application-specific advantages for drug development and synthetic biology research.
Fundamental Principles and Comparative Analysis
Picoinjection
Picoinjection is an electro-microfluidics technique used to add controlled volumes of reagent into pre-formed droplets at kilohertz rates [29]. The mechanism involves flowing droplets past a pressurized side channel containing the injection reagent. A surfactant-stabilized interface normally prevents the reagent from entering the droplet. However, upon applying an electric field across this interface, an electrically induced thin-film instability destabilizes the surfactant layer, rupturing the film and allowing the pressurized reagent to be injected into the droplet [30] [29]. The electric field can be switched on and off within microseconds, allowing for selective, pattern-based, or single-droplet injection. The volume injected is controlled with sub-picoliter precision by adjusting the injection pressure and the flow rate of the continuous oil phase [29].
Droplet Merging (Electrocoalescence)
Droplet merging, or electrocoalescence, is an alternative technique for reagent addition. It involves bringing two droplets into contact and applying an electric field to destabilize their interfacial films, causing them to coalesce into a single droplet [31]. This method is particularly useful for initiating reactions by combining reagents from two distinct sources. Passive merging strategies, such as using decompression chambers that bring droplets into close contact to promote natural coalescence, also exist [31]. However, a significant challenge with active merging is the need for precise synchronization of droplet pairs, which can limit throughput and operational robustness compared to picoinjection [29].
Technique Selection: Quantitative Comparison
The choice between picoinjection and droplet merging depends on the specific requirements of the assay. The following table summarizes the key performance characteristics of both techniques, drawing from experimental data.
Table 1: Quantitative Comparison of Picoinjection and Droplet Merging
| Feature | Picoinjection | Droplet Merging (Electrocoalescence) |
|---|---|---|
| Primary Mechanism | Electric-field triggered injection from a pressurized channel [30] [29] | Electric-field induced coalescence of two droplets [31] |
| Throughput | Up to ~10 kHz [29] | High, but limited by droplet pairing synchronization [29] |
| Injection/Merger Control | Highly controlled via electric field switching; selective injection possible [29] | Controlled by electric field, but requires precise droplet pairing [29] |
| Volume Control | High precision (0.1 - 3 pL range); adjusted via pressure and flow rate [29] | Determined by the volumes of the two parent droplets |
| Key Advantage | Insensitive to droplet arrival periodicity; robust serial & combinatorial additions [30] [29] | Directly combines two distinct reagent sets |
| Key Limitation | Requires electrode integration and pressure control | Requires synchronization of two droplet streams [29] |
| Ideal Application | Serial additions, multi-step assays, combinatorial screening [29] | Initiating reactions between two complete reagent sets |
Experimental Protocols
Protocol for Picoinjection
This protocol describes the setup and operation of a picoinjector for adding reagents into an existing stream of water-in-oil droplets.
Materials and Reagents
- Microfluidic Device: PDMS device with integrated picoinjector and liquid-solder electrodes [29].
- Syringe Pumps: High-precision pumps for controlling oil and reagent flows.
- Function Generator: For applying AC or DC electric fields (e.g., 30-40 V, 1-10 kHz) [29].
- Continuous Phase Oil: Fluorinated oil (e.g., Fluo-Oil 135 or 200) stabilized with biocompatible surfactants (e.g., 1-2% Emulseo FluoSurf) [31].
- Dispersed Phase: Aqueous droplets containing cells or biochemical components.
- Injection Reagent: Aqueous solution of the reagent to be added.
Step-by-Step Procedure
- Device Priming: Place the device on a microscope stage. Prime all oil channels with the continuous phase oil. Prime the injection reagent channel with the reagent solution.
- Pressure Balancing: Adjust the injection pressure ((P{in})) to be higher than the oil channel pressure ((P{out})) to create a stable, curved interface at the injection orifice. The Laplace pressure ((ΔP = γ / r), where γ is interfacial tension and r is radius of curvature) maintains equilibrium [29].
- Droplet Introduction: Introduce the stream of aqueous droplets into the main channel at the desired volume fraction. An upstream spacer junction can be used to add oil and ensure droplets are in single file with adequate spacing [29].
- Injection Triggering:
- Connect the function generator to the integrated electrodes.
- Set the electric field to a voltage above the instability threshold (typically >30 V [29]).
- As a droplet passes the injection orifice, trigger the electric field. The field should be applied for the duration the drop is at the orifice (typically milliseconds).
- The interface will rupture, and reagent will be injected into the droplet. The bridge will break as the droplet moves away.
- Volume Calibration:
- Via Pressure: The volume injected is linearly proportional to the injection pressure. To increase volume, increase (P_{in}) [29].
- Via Flow Rate: The volume injected is inversely proportional to the oil flow rate. To decrease volume, increase the oil flow rate [29].
- Calibrate by measuring the change in droplet size before and after injection. Model droplets as cylinders with rounded ends to calculate volume change [29].
- Selective Injection: To inject specific droplets, use a droplet detection system (e.g., a camera and image analysis software) to trigger the electric field only when a target droplet is in position.
Protocol for Active Droplet Merging via Electrocoalescence
This protocol outlines the process for merging two distinct droplet populations.
Materials and Reagents
- Microfluidic Device: PDMS device designed to synchronize and merge two droplet streams, with integrated electrodes at the merging junction.
- Syringe Pumps: For controlling oil and aqueous phase flows.
- Function Generator: For applying the merging electric field.
- Continuous Phase Oil: Fluorinated or silicone oil with appropriate surfactants.
- Dispersed Phases: Two aqueous solutions to be merged (e.g., one containing cells, the other containing an inducer).
Step-by-Step Procedure
- Device and Flow Setup: Prime the device with oil. Generate two separate, synchronized streams of droplets using upstream T-junctions or flow-focusing geometries.
- Droplet Pairing: Use channel geometry (e.g., a channel that brings the two streams into contact) to reliably pair one droplet from each stream. Achieving this synchronization is critical and can be the most challenging step [29].
- Merger Triggering:
- Guide the paired droplets to a merging chamber where they are held in contact.
- Apply an electric field (e.g., ~1-2 kV/cm, 1-10 kHz) across the electrode pair. The field destabilizes the surfactant films on the contacting interfaces of the two droplets.
- Coalescence will occur rapidly, forming a single, larger droplet.
- Downstream Collection: Allow the merged droplets to exit the merging zone and continue to incubation chambers or analysis modules.
The Scientist's Toolkit: Essential Research Reagent Solutions
Successful implementation of picoinjection and merging relies on specialized materials and reagents. The following table details key solutions for generating and manipulating stable droplets.
Table 2: Essential Reagents for Droplet Manipulation
| Item Name | Function/Description | Key Application Note |
|---|---|---|
| FluoSurf Surfactants | Biocompatible surfactants for fluorinated oils. Reduce interfacial tension and prevent droplet coalescence during thermocycling, which is critical for assays like digital PCR [31]. | Essential for maintaining droplet integrity during picoinjection and preventing unwanted coalescence in high-density streams [31]. |
| Fluorinated Oils (e.g., Fluo-Oil 135/200) | Continuous phase oils for forming water-in-oil emulsions. Chemically inert and compatible with biological systems [31]. | The standard continuous phase for bio-applications. Properties are well-matched with FluoSurf surfactants [31]. |
| Hydrophobic Surface Treatments (e.g., Fluo-ST1) | Covalently bonds to PDMS channel walls to create a hydrophobic surface [31]. | Prevents aqueous droplets from wetting the channel walls in water-in-oil systems, ensuring smooth transport and reducing fouling [31]. |
| Liquid-Solder Electrodes | Electrodes fabricated by injecting low melting-point solder into microchannels within the PDMS device [29]. | Provides a simple method for creating high-resolution, integrated electrodes necessary for triggering picoinjection and electrocoalescence [29]. |
Workflow and System Integration
The power of picoinjection is fully realized when integrated into a complete microfluidic circuit. This allows for the automation of complex, multi-step assays. The following diagram illustrates a potential workflow for combinatorial screening using multiple picoinjectors.
Diagram 1: Combinatorial Screening with Serial Picoinjection
This workflow shows how a stream of droplets, generated and spaced upstream, can pass by a series of independently controlled picoinjectors. Based on a detection signal or a pre-programmed pattern, each picoinjector can be selectively activated to add a specific reagent (A, B, or C). This enables the creation of a diverse library of reagent combinations within the droplets for high-throughput applications like combinatorial chromatin regulator screening [28] [29]. The droplets then proceed to an incubation region for reaction before final analysis and sorting.
Fluorescence-Activated Droplet Sorting (FADS) for Hit Identification
Fluorescence-Activated Droplet Sorting (FADS) has emerged as a powerful tool in high-throughput screening, enabling the phenotypic analysis and isolation of single cells or enzymatic reactions compartmentalized within water-in-oil emulsion droplets [32] [33]. This technology is particularly transformative for the field of synthetic biology, where it facilitates the directed evolution of enzymes and the functional screening of synthetic genetic circuits by providing a direct link between a desired cellular function (phenotype) and its genetic encoding (genotype) [32] [5]. By screening synthetic gene circuit libraries encapsulated in droplets, researchers can identify rare "hits"—variants that exhibit optimal dynamic behaviors such as oscillation, switching, or fine-tuned expression in response to specific inducers [5]. The ability to screen >10^8 variants per day using 10^6-fold less reagent volume than conventional robotic systems makes FADS an indispensable method for accelerating the development of biomedical applications and advanced biocatalysts [32].
The core FADS workflow for hit identification involves the sequential encapsulation, processing, analysis, and sorting of individual gene circuit variants. The following diagram illustrates the complete process from library preparation to hit recovery.
Experimental Protocols
Droplet Generation and Cell Encapsulation
The initial step involves the microfluidic generation of monodisperse water-in-oil droplets containing individual members of the genetic circuit library.
- Objective: To compartmentalize single E. coli cells, each harboring a unique synthetic gene circuit variant, into uniform picoliter-volume droplets along with assay reagents [32].
- Materials:
- Microfluidic Device: Fluorocarbon-coated PDMS device with a flow-focusing junction [32].
- Aqueous Phase: E. coli suspension (OD~600~ ≈ 0.05) in Luria-Bertani (LB) medium or appropriate buffer, containing the plasmid library [32].
- Oil Phase: Fluorinated oil (e.g., HFE7500) supplemented with 2% (w/w) PEG-PFPE amphiphilic block copolymer surfactant [32] [33].
- Procedure:
- Load the aqueous cell suspension and oil phase into separate syringes.
- Connect syringes to the microfluidic device via appropriate tubing.
- Apply precise pressure to both phases using a pressure pump (e.g., Fluigent MFCS) to achieve a stable flow. Typical pressures are 500 mbar for the aqueous phase and 1 bar for the oil phase [33].
- Monitor droplet formation at the flow-focusing junction. Droplets of ~20 µm diameter are generated at a frequency of approximately 30 kHz [32].
- Collect the emulsion in a sterile microcentrifuge tube.
- Critical Parameters:
- Cell Density: Adjust the OD~600~ to 0.05 to achieve a Poisson distribution (λ = 0.1), ensuring that over 95% of occupied droplets contain only a single cell [32].
- Droplet Stability: Verify droplet uniformity and absence of coalescence under a microscope. Stable droplets can be stored at room temperature for several hours.
Protein Expression and Cell Lysis within Droplets
Following encapsulation, the droplets are incubated to allow for gene circuit expression, followed by cell lysis to release the encoded enzymes.
- Objective: To express the synthetic gene circuit and release the functional gene products (e.g., enzymes) into the droplet interior for subsequent biochemical assays [32].
- Materials:
- Thermal Lysis: Thermostable water bath or heat block.
- Chemical Lysis: BugBuster reagent or Lysozyme (0.1 mg/mL final concentration) [32].
- Procedure:
- Protein Expression:
- Incubate the collected emulsion droplets at a permissive temperature for protein expression (e.g., 30°C for 2-4 hours). The duration depends on the specific gene circuit and promoter strength.
- Cell Lysis: Choose one of the following methods.
- Thermal Lysis (for thermostable enzymes):
- Incubate the emulsion at 90-95°C for 5 minutes [32].
- Chemical Lysis (for mesophilic enzymes):
- Thermal Lysis (for thermostable enzymes):
- Protein Expression:
- Validation:
- Lysis efficiency can be confirmed using a control strain expressing a fluorescent protein (e.g., GFP). Successful lysis is indicated by the diffusion of fluorescence throughout the droplet volume, rather than its confinement to the cell [32].
Enzymatic Assay and Fluorescence-Activated Sorting
This is the core hit identification step, where droplets containing functional gene circuits are identified and selectively isolated based on a fluorescent output.
- Objective: To trigger a fluorescent reaction within each droplet that reports on the activity of the encapsulated gene circuit and to physically sort droplets exceeding a fluorescence threshold [32] [33].
- Materials:
- FADS Instrument: Custom-built or commercial system comprising:
- Microfluidic sorting chip bonded to an ITO glass slide [33].
- Optical system: Laser for excitation (e.g., 550 nm for Cy3), photomultiplier tubes (PMTs) or photodiodes for emission detection (~570 nm for Cy3), and a high-speed camera (optional) [32].
- Electronic system: Waveform generator for applying dielectrophoretic (DEP) force and a high-voltage amplifier [33].
- Fluorescent Sensor: Substrate designed to produce a fluorescent signal upon reaction with the target enzyme. For nucleic acid modifying enzymes, this is often an oligonucleotide probe with a fluorophore (e.g., Cy3) and a quencher (e.g., Iowa Black) [32].
- FADS Instrument: Custom-built or commercial system comprising:
- Procedure:
- Reinject Emulsion: Hydrodynamically focus the emulsion into a narrow stream within the sorting chip using a carrier oil phase.
- Fluorescence Detection: As each droplet passes the laser interrogation point, its fluorescence intensity is measured.
- Signal Processing: A computer algorithm processes the signal in real-time. Droplets with fluorescence intensity above a predefined threshold are designated for sorting [33].
- Dielectrophoretic Sorting: Upon detection of a target droplet, an AC electric field (e.g., 30 kHz) is applied briefly (~1 ms) across the sorting junction. The dielectric contrast between the water droplet and oil phase induces a DEP force, deflecting the target droplet into the collection channel [33].
- Collection: Sorted droplets are gathered into a sterile tube containing a breaking solution (e.g., 1H,1H,2H,2H-Perfluoro-1-octanol) to destabilize the emulsion for downstream genetic analysis.
- Critical Parameters:
Key Performance Data and Specifications
The quantitative performance of a FADS system is critical for planning and evaluating a hit identification campaign. The following table summarizes key metrics and parameters.
Table 1: Quantitative Performance Metrics of FADS
| Parameter | Typical Value/Range | Notes / Context |
|---|---|---|
| Droplet Generation Rate | ~30 kHz [32] | Depends on microfluidic device geometry and flow rates. |
| Droplet Diameter | ~20 µm [32] | Results in a droplet volume of ~4 pL. |
| Cell Encapsulation | λ = 0.1 (Poisson) [32] | Optimized to ensure >95% of occupied droplets contain a single cell. |
| Throughput (Screening) | Up to 10^8 variants/day [32] | Significantly higher than conventional robotic systems (~10^4 variants). |
| Sorting Rate | ~2-3 kHz [32] | Can be several hundred Hz to kHz for multiplexed sorts [33]. |
| False Positive/Negative Rate | Low [32] | Highly dependent on assay signal-to-noise ratio and gating strategy. |
| Enrichment Factor | >3,000-fold [32] | Demonstrated in a mock screen with one active variant in a background of 6,447 inactive ones. |
The selection of an appropriate fluorescent assay is equally important. The table below outlines common assay strategies for different types of enzymatic activities relevant to genetic circuit function.
Table 2: Fluorescent Assay Strategies for Enzymatic Hit Identification
| Target Enzyme Activity | Assay Principle | Example Sensor/Substrate | Key Feature |
|---|---|---|---|
| Polymerase (Primer Extension) | Separation of fluorophore from quencher via strand synthesis. | DNA primer with 5' fluorophore (Cy3) and 3' quencher (Iowa Black) [32]. | High signal-to-noise ratio [32]. |
| Polymerase (Strand Displacement) | Displacement of a quenched strand, releasing fluorescence. | Dual-labeled oligonucleotide partially hybridized to a complementary quencher strand [32]. | Signals enzyme processivity. |
| Ligase | Ligation of two oligonucleotides brings fluorophore and quencher into proximity. | Two adjacent DNA/RNA strands, one with a fluorophore and the other with a quencher [32]. | Fluorescence decreases upon successful ligation. |
| Restriction Endonuclease | Cleavage of a dual-labeled substrate separates fluorophore from quencher. | oligonucleotide with fluorophore and quencher at opposite ends [32]. | Fluorescence increases upon cleavage. |
The Scientist's Toolkit: Essential Reagents and Materials
Successful implementation of FADS relies on a specialized set of reagents and equipment.
Table 3: Essential Research Reagent Solutions for FADS
| Item | Function / Description | Example / Specification |
|---|---|---|
| PEG-PFPE Surfactant | Stabilizes water-in-oil droplets to prevent coalescence during incubation, thermal cycling, and storage [32] [33]. | 2% (w/w) in fluorinated oil (e.g., HFE7500) [33]. |
| Fluorinated Oil | Forms the continuous phase of the emulsion. Biocompatible and immiscible with aqueous cell media. | HFE7500 (3M) [33]. |
| Fluorophore-Quencher Pair | Forms the basis of the fluorescent sensor to report enzymatic activity. | Cy3 (fluorophore) and Iowa Black (quencher) for high SNR [32]. |
| Lysis Reagents | Releases expressed enzymes from E. coli inside droplets without disrupting the emulsion. | BugBuster (1x) for 37°C lysis or Lysozyme (0.1 mg/mL) for 55°C lysis [32]. |
| Dielectrophoretic Sorting Chip | PDMS microfluidic device where droplet reinjection, detection, and sorting occur. | Features a sorting junction with integrated electrodes, plasma-bonded to an ITO-coated glass slide [33]. |
Advanced Applications and Multiplexed Sorting
The fundamental FADS workflow can be extended to more complex screening paradigms. Multiplexed sorting allows for the simultaneous isolation of multiple droplet populations based on different fluorescence intensities or signatures in a single experimental run, greatly enhancing screening efficiency [33]. This is achieved by employing a computer-controlled algorithm that applies electric pulses to direct droplets into one of several output channels based on pre-defined gating criteria [33]. Furthermore, the integration of automated systems, such as iSort, aims to democratize FADS technology by reducing its operational complexity and enabling "plug and play" long-term screening campaigns [34]. The following diagram illustrates the logic of a multiplexed sorting decision.
Fluorescence-Activated Droplet Sorting provides a robust and high-throughput platform for identifying functional hits from vast libraries of synthetic genetic circuits. By combining ultra-high-throughput screening with single-cell resolution and minimal reagent consumption, FADS overcomes the limitations of traditional screening methods. The detailed protocols, performance metrics, and essential tools outlined in this application note provide a foundation for researchers to implement this powerful technology for advancing synthetic biology and drug discovery.
The integration of cell-free systems with high-throughput microfluidic technologies is revolutionizing synthetic biology and therapeutic development. These platforms eliminate the constraints of cell-based systems, such as cell wall barriers and complex cloning steps, enabling rapid design-build-test cycles for synthetic genetic circuits [35]. This application note details experimental case studies and protocols where cell-free protein synthesis (CFPS) and microfluidic screening have accelerated protein engineering and antibody discovery, providing a framework for researchers to implement these advanced methodologies.
Case Study: Rapid Antibody Discovery Against SARS-CoV-2
Background and Objective
The COVID-19 pandemic underscored the critical need for platforms that can rapidly identify and characterize neutralizing antibodies. Traditional antibody discovery workflows, reliant on cell-based expression and purification, require several weeks to evaluate candidates, creating a significant bottleneck during public health emergencies [36]. This case study demonstrates a cell-free pipeline that compressed this timeline to less than 24 hours for profiling hundreds of antibody candidates targeting the SARS-CoV-2 spike protein.
Experimental Workflow and Key Results
The integrated cell-free workflow combined four key technological developments [36]:
- Cell-free DNA assembly and amplification via Gibson assembly and PCR to generate linear expression templates (LETs) without cellular cloning.
- High-yielding CFPS using an E. coli lysate-based system engineered for disulfide bond formation to express synthetically dimerized antigen-binding fragments (sdFabs).
- Rapid binding characterization using an Amplified Luminescent Proximity Homogeneous Linked Immunosorbent Assay (AlphaLISA) performed directly from crude CFPS reactions, eliminating purification.
- Acoustic liquid handling to enable highly parallel, miniaturized reactions in 384-well plates.
The platform was validated using 135 previously published anti-SARS-CoV-2 antibodies, including all 8 that had received emergency use authorization. The cell-free binding assay successfully identified these potent antibodies, with the rank order of half-maximal inhibitory concentration (IC₅₀) values aligning well with established ELISA data [36]. Subsequently, the workflow screened 119 antibodies from an immunized mouse and identified several neutralizing candidates, including the antibody SC2-3, which bound the spike protein of all tested variants of concern.
Table 1: Key Performance Metrics from Cell-Free Antibody Screening
| Parameter | Traditional Workflow | Cell-Free Workflow | Improvement |
|---|---|---|---|
| Time for screening 100+ candidates | Weeks to months [36] | < 24 hours [36] | >10x acceleration |
| Reaction volume | Milliliter scale | 2 µL [36] | >500x miniaturization |
| Key enabling technology | Cell-based expression, protein purification | Acoustic liquid handling, AlphaLISA [36] | Elimination of purification |
| Primary outcome | Identification of lead candidates | Identification of SC2-3 antibody against variants [36] | Successful discovery of cross-reactive antibody |
Detailed Protocol: Cell-Free Antibody Expression and Screening
Materials:
- Synthetic dsDNA coding for antibody VH and VL chains
- DNA for constant regions and pJL1 vector backbone
- Gibson assembly mix
- PCR reagents
- E. coli Origami B(DE3) crude extract CFPS system
- Iodoacetamide (IAM)
- Purified DsbC and FkpA proteins
- AlphaLISA donor and acceptor beads
- 384-well plates
- Acoustic liquid handler
Procedure:
- DNA Template Preparation (3 hours):
- Perform Gibson assembly in a 384-well plate by mixing dsDNA fragments for VH, VL, constant regions, and vector backbone.
- Use the unpurified assembly product as a template for PCR to generate linear expression templates (LETs). Verify proper assembly via control reactions (e.g., sfGFP expression) [36].
Cell-Free Protein Synthesis (4-6 hours):
- Prepare the CFPS master mix on ice containing E. coli Origami extract, IAM (to inhibit reductases), and supplemented with DsbC and FkpA to promote disulfide bonding and proper folding [36].
- Use an acoustic liquid handler to dispense 2 µL of the master mix into 384-well plates.
- Add the LETs to initiate the reaction. Incubate at a controlled temperature (e.g., 30°C) for protein synthesis.
Binding Assay via AlphaLISA (2 hours):
- Directly after CFPS, mix a portion of the crude reaction with AlphaLISA donor and acceptor beads. The beads are configured to capture the expressed sdFab and the target antigen (e.g., SARS-CoV-2 RBD) [36].
- Incubate the mixture in the dark to allow complex formation.
- Read the chemiluminescent signal on a compatible plate reader. A signal indicates successful sdFab assembly and antigen binding.
Case Study: AI-Driven Optimization of Cell-Free Systems
Background and Objective
The complexity and cost of CFE systems, which often require dozens of supplementary components, present a major barrier to their widespread adoption. Empirically optimizing these systems is impractical due to the vast combinatorial space of potential component concentrations. This case study employs an AI-guided, high-throughput droplet microfluidics strategy termed "DropAI" to streamline and optimize CFE system formulations [2].
Experimental Workflow and Key Results
The DropAI platform combines microfluidics and machine learning in a two-step process [2]:
- In-droplet screening: A microfluidic device generates picoliter-sized droplet reactors, each containing a unique combination of CFE components. The composition of each droplet is encoded using a fluorescent color-coding system ("FluoreCode"). The yield of expressed reporter protein (e.g., sfGFP) in each droplet is measured.
- In silico optimization: The experimental data from thousands of droplets are used to train a machine learning model. This model predicts the contribution of each component to the overall yield and recommends high-performing formulations for experimental validation.
Applying this to an E. coli-based CFE system, DropAI screened 12 additives and identified only 3 as essential. The optimized formulation achieved a 2.1-fold decrease in unit cost and a 1.9-fold increase in sfGFP yield. The model was further adapted to a Bacillus subtilis-based system using transfer learning, which doubled the yield with minimal new experimental data [2].
Table 2: Outcomes of AI-Optimized Cell-Free Systems
| Optimization Parameter | E. coli CFE System | B. subtilis CFE System |
|---|---|---|
| Number of additives screened | 12 [2] | Via transfer learning [2] |
| Final essential additives | 3 [2] | Not specified |
| Impact on Yield | 1.9-fold increase [2] | 2-fold increase [2] |
| Impact on Cost | 2.1-fold reduction (unit cost) [2] | Not specified |
| Broad Applicability | Validated with 12 different proteins (27-370 kDa) [2] | Validated with sfGFP and antimicrobial peptides [2] |
Detailed Protocol: DropAI for CFE System Optimization
Materials:
- Microfluidic droplet generation device
- Fluorinated oil with PEG-PFPE surfactant
- CFE components: cell extract, energy sources, nucleotides, amino acids, additives
- Fluorescent dyes for color-coding
- Poloxamer 188 (P-188) and PEG-6000 for emulsion stabilization
- PCR machine or thermal chamber for incubation
- Microscope with multi-channel fluorescence detection
Procedure:
- Droplet Library Generation (3 minutes for 50,000 droplets):
- Prepare separate pools of satellite droplets, each containing a unique set of CFE components labeled with distinct fluorescent colors and intensities [2].
- Use the microfluidic device to sequentially merge one carrier droplet (containing the basic CFE mixture) with three satellite droplets. The resulting merged droplet contains a unique combination of components, identifiable by its FluoreCode [2].
In-Droplet CFE and Incubation:
- Collect the emulsions and incubate them at a controlled temperature (e.g., 30°C) for several hours to allow for protein expression.
- Stabilize the emulsions by adding P-188 and PEG-6000 to the aqueous phase prior to droplet generation [2].
Fluorescence Imaging and Data Extraction:
- Image the droplets under multiple fluorescence channels to read the FluoreCode (composition) and the output signal (e.g., sfGFP fluorescence) for each droplet [2].
- Process the intensity data with a custom program to decode the composition of each droplet and correlate it with the measured yield.
Machine Learning and Model Prediction:
- Use the dataset of compositions and yields to train a machine learning model (e.g., random forest).
- The model estimates the contribution of each component and predicts untested combinations with high yield potential [2].
- Select the top-predicted formulations for in vitro validation in a standard tube-based CFE reaction.
The Scientist's Toolkit: Research Reagent Solutions
Table 3: Essential Reagents for High-Throughput Cell-Free Screening
| Reagent / Material | Function / Application | Specific Example / Note |
|---|---|---|
| E. coli Origami B(DE3) Extract | CFPS lysate with mutated reductase pathways (trxB/gor) to enable cytoplasmic disulfide bond formation [36]. | Essential for expressing antibodies and other disulfide-bonded proteins. |
| Iodoacetamide (IAM) | Reductase inhibitor. Pretreatment of cell extract stabilizes the redox environment, further promoting disulfide bond formation [36]. | Used in the antibody expression protocol. |
| DsbC & FkpA | Chaperone proteins. DsbC is a disulfide isomerase; FkpA is a prolyl isomerase. Both improve folding and assembly of complex proteins in CFPS [36]. | Supplemented directly into the CFPS reaction. |
| AlphaLISA Beads | Enable homogeneous, wash-free binding assays directly in complex mixtures like crude CFPS reactions [36]. | Critical for high-throughput screening without purification steps. |
| Linear Expression Template (LET) | DNA template for CFPS, generated by PCR or assembly. Bypasses the need for time-consuming plasmid cloning and transformation [36]. | Enables rapid testing of genetic designs. |
| PEG-PFPE Surfactant | Biocompatible surfactant for stabilizing water-in-oil emulsions in microfluidic applications, preventing droplet coalescence [2]. | Essential for droplet-based microfluidics. |
| Poloxamer 188 (P-188) | Non-ionic triblock copolymer surfactant. Works as an emulsion stabilizer in droplet-based biochemical assays [2]. | Used with PEG-6000 to stabilize CFE-in-droplet. |
Overcoming Hurdles: From Technical Challenges to AI-Driven Optimization
High-throughput screening (HTS) of synthetic genetic circuits using droplet microfluidics represents a transformative approach in synthetic biology and drug development. This technology enables the encapsulation of biological reactions in picoliter droplets, functioning as isolated microreactors for rapid, parallel testing of thousands of genetic designs. However, key challenges including droplet stability, cross-contamination, and efficient library generation must be systematically addressed to ensure experimental success. This application note provides detailed protocols and data-driven solutions to overcome these hurdles, facilitating robust and reproducible screening outcomes for researchers and drug development professionals.
Quantitative Challenge Analysis
The table below summarizes the core challenges in droplet-based screening and the corresponding quantitative performance targets for successful experiments.
Table 1: Key Challenges and Performance Targets in Droplet-based Screening
| Challenge | Impact on Experiments | Performance Target | Validated Solution |
|---|---|---|---|
| Droplet Stability | Unstable emulsions lead to droplet coalescence, loss of compartmentalization, and data loss. | >90% emulsion stability over >72 hours incubation [2]. | Use of PEG-PFPE surfactant with Poloxamer 188 (P-188) and PEG-6000 as stabilizers [2]. |
| Cross-Contamination | Molecule transfer between droplets compromises data integrity and leads to false positives/negatives. | Highly uniform droplets with size variation <5% Coefficient of Variation (CV) to ensure monodispersity [11]. | Employ flow-focusing geometries and biocompatible surfactants to maintain droplet integrity [2] [11]. |
| Library Generation Throughput | Low combinatorial construction speed creates bottlenecks, limiting the scale and diversity of genetic circuits tested. | Generation of ~1,000,000 unique combinations per hour [2]. | Implementation of fluorescent color-coding (FluoreCode) to encode and trace compositions [2]. |
Experimental Protocols
Protocol for Stable Droplet Generation and Maintenance
This protocol ensures the generation of highly stable, monodisperse droplets suitable for long-term cell-free gene expression (CFE) reactions.
Materials:
- Microfluidic Device: Flow-focusing droplet generation chip [11].
- Continuous Phase: Fluorinated oil (e.g., HFE 7500).
- Surfactant: PEG-PFPE (e.g., 2% w/w in fluorinated oil) [2].
- Aqueous Phase Stabilizers: Poloxamer 188 (P-188) and Polyethylene glycol 6000 (PEG-6000) [2].
- Dispersed Phase: CFE reaction mixture, including cell lysate, DNA template, and energy substrates.
Procedure:
- Aqueous Phase Preparation: To your standard CFE reaction mixture, add the stabilizers Poloxamer 188 and PEG-6000. The final concentration must be optimized for your specific system but typically ranges from 0.5% to 2% (w/v) [2].
- Oil Phase Preparation: Dissolve PEG-PFPE surfactant in fluorinated oil at a concentration of 2% (w/w). Ensure complete dissolution by vortexing and brief sonication.
- Device Priming: Load the syringe containing the continuous phase (oil with surfactant) and thoroughly prime the microfluidic device to remove all air bubbles.
- Droplet Generation: Co-load the syringes for the continuous and dispersed (aqueous) phases into the pump system. Initiate flow using a pressure- or flow-rate-controlled system. For a flow-focusing geometry, typical flow rate ratios (continuous-to-dispersed phase) range from 3:1 to 5:1 to achieve stable jetting or dripping regimes [12].
- Collection and Incubation: Collect the generated emulsion in a PCR tube or a suitable, surfactant-coated container. Incubate the droplets at the desired reaction temperature (e.g., 30°C for E. coli-based CFE). Stability should be maintained for over 72 hours [2].
Protocol for High-Throughput Combinatorial Library Generation
This protocol outlines the "DropAI" strategy for creating massive combinatorial libraries of CFE system components, encoded via fluorescence for deconvolution [2].
Materials:
- Specialized Microfluidic Device: A device capable of generating and merging carrier droplets with satellite droplets [2].
- Fluorescent Dyes: A set of non-interfering fluorescent dyes for color-coding (e.g., for 4 distinct color channels).
- Component Libraries: Stock solutions of CFE components to be screened (e.g., energy sources, nucleotides, cofactors).
- Carrier Droplet Solution: Master CFE mixture without the variable components.
Procedure:
- Library Encoding:
- Aliquot each component from your screening library (e.g., 12 different additives) into a unique satellite droplet pool.
- Dope each satellite pool with a specific combination of fluorescent dyes and intensities—a "FluoreCode." With 4 colors and 9 intensity levels, 6,561 (9^4) unique combinations can be encoded [2].
- Droplet Pool Generation: Generate pools of carrier droplets (containing the base CFE mix) and the encoded satellite droplets using the microfluidic device.
- Microfluidic Combination:
- Stream the carrier droplets through the device to sequentially meet and merge with satellite droplets containing the encoded components.
- Use a micro-teeth structure or similar passive/active merging mechanism to achieve high-efficiency fusion (~90% success rate) [2].
- The final merged droplet contains a unique combinatorial condition, identified by its FluoreCode.
- Incubation and Imaging: Incubate the entire emulsion library. After incubation, image the droplets using a high-throughput microscope equipped with the appropriate fluorescence filter sets for your chosen dyes.
- Data Deconvolution:
- Use image analysis software to read the FluoreCode of each droplet and match it to its corresponding combinatorial formulation.
- Correlate the output (e.g., sfGFP fluorescence) with the formulation to identify high-performing combinations.
Protocol for Machine Learning-Guided Optimization
This protocol uses initial experimental data to train a model that predicts optimal genetic circuit performance or CFE formulations.
Procedure:
- Initial Data Collection: Perform a primary screen using the library generation protocol (3.2) or a smaller-scale pilot experiment. The dataset should include the composition of each condition (input) and its corresponding yield or activity (output).
- Model Training: Use this dataset to train a machine learning model. For instance, a Residual Block Network (ResBNet) has demonstrated high accuracy in predicting microfluidic outcomes from complex data [12].
- In Silico Optimization: Use the trained model to explore a vast combinatorial space computationally. The model predicts high-yield combinations that were not physically tested in the initial screen.
- Validation: Select the top in silico predicted hits and validate them experimentally in the lab using the droplet generation protocol (3.1). This step confirms the model's predictions and delivers verified, optimized systems.
Workflow Visualization
The following diagram illustrates the integrated high-throughput screening workflow, from droplet generation to AI-driven analysis.
The Scientist's Toolkit
Table 2: Essential Research Reagent Solutions for Droplet-Based Screening
| Item | Function/Application | Key Considerations |
|---|---|---|
| PEG-PFPE Surfactant | Prevents droplet coalescence by forming a stable biocompatible monolayer at the oil-water interface [2]. | Critical for long-term stability of emulsions; compatibility with biological systems is essential. |
| Poloxamer 188 & PEG-6000 | Polymer additives that increase emulsion stability and protect biomolecules within droplets [2]. | Concentrations must be optimized to avoid inhibition of the biological reaction (e.g., CFE). |
| Fluorescent Tracer Dyes | Encoding satellite droplets with unique "FluoreCodes" to trace the composition of each microreactor [2]. | Dyes must be non-toxic, stable, and have distinct emission spectra to avoid crosstalk. |
| Fluorinated Oil (HFE 7500) | Serves as the continuous phase; oxygen-permeable and biocompatible for cell-based assays. | High purity is required to prevent toxicity and ensure consistent droplet generation. |
| Residual Block Network (ResBNet) | A machine learning model for high-accuracy prediction of droplet characteristics and inverse design of device geometry [12]. | Replaces time-consuming simulations; requires a dataset for training. |
| Cell-Free Gene Expression System | A crude cellular extract that enables in vitro transcription and translation of synthetic genetic circuits [2]. | The chassis (E. coli, B. subtilis) and preparation method significantly impact yield and cost. |
Strategies for Robust Multi-Step Operations and On-Chip Incubation
Within the context of high-throughput screening (HTS) for synthetic genetic circuits and drug development, achieving robust multi-step operations and on-chip incubation is paramount. Microfluidic technology has emerged as a powerful solution, enabling the precise manipulation of fluids and cells at the micron scale to perform complex, multi-step biological assays in a highly miniaturized and automated format [37] [38]. These platforms provide very well-defined control over the cellular microenvironment due to precise fluid handling, which is critical for reliable screening outcomes [38]. The ability to perform complete workflows—from cell culture and stimulation to fixation, staining, and imaging—on a single, integrated device dramatically increases throughput, reduces reagent consumption and costs, and minimizes human error, thereby enhancing the robustness of screening campaigns for novel genetic constructs or therapeutic compounds [38].
Core Microfluidic Strategies for Complex Operations
For synthetic genetic circuit screening, two primary microfluidic architectures enable complex, multi-step protocols: highly integrated valve-based systems and ultra-high-throughput droplet-based systems. The choice between them depends on the screening goals, with the former offering exquisite temporal control and the latter providing massive parallelism.
Highly Integrated Valve-Based Systems
These systems utilize networks of microfabricated membrane valves to precisely route fluids within a device. This architecture allows for the automated execution of complex, sequential assay steps such as cell loading, medium exchange, timed stimulations with inducers (e.g., for circuit activation), fixation, and immunostaining [38].
A key design employs multiple separate compartments that can be fluidically addressed by actuating a manifold of integrated membrane valves [38]. In a typical experiment, about 300 cells are loaded into each of 32 compartments, enabling nearly 10,000 individual cell experiments on a single device. This design facilitates various critical experiment types:
- Detailed Time-Course Studies: Measuring signaling or gene expression dynamics at multiple time points from rapid early events to slower late responses [38].
- Multi-Stimuli Screening: Exposing different cell groups to various stimuli or inhibitor combinations in parallel by partitioning chambers into fluidically isolated groups [38].
- Complex Temporal Inputs: Mimicking physiologically relevant dynamic stimuli like periodic dosing or gradually decreasing concentrations to study genetic circuit behavior under more natural conditions [38].
Droplet-Based Microfluidic Systems
Droplet microfluidics compartmentalizes reactions into picoliter- to nanoliter-volume droplets, each acting as an independent microreactor [39] [40]. This system is ideal for ultra-high-throughput screening of vast libraries.
Droplet Formation is typically achieved via passive methods using T-junction, flow-focusing, or co-flow geometries [39]. The table below summarizes the key droplet generation geometries.
Table 1: Common Microfluidic Droplet Generation Geometries
| Geometry | Description | Key Characteristics |
|---|---|---|
| T-Junction | Dispersed and continuous phases meet at an angle (typically 90°) [39]. | Simple design and operation; droplet size influenced by channel dimensions, flow rate, and fluid viscosity [39]. |
| Flow-Focusing | Dispersed phase is hydrodynamically focused by the continuous phase from two sides [39]. | Produces highly monodisperse droplets; size and frequency controlled by adjusting flow rate ratios [39]. |
| Co-Flow | Dispersed phase flows coaxially within the continuous phase [39]. | Operates in dripping or jetting regimes; can generate droplets from low to high viscosity fluids [39]. |
The core workflow involves: encapsulating single cells or genetic circuit variants into droplets, incubating them to allow for circuit expression or function, running functional assays that induce fluorescence in positive hits, and sorting target droplets at ultra-high-throughput rates [41]. A major advantage is the ability to detect both intracellular signals and secreted extracellular products within the confined droplet environment [40].
Quantitative Comparison of Operational Advantages
The miniaturization and integration offered by microfluidics translate into direct, quantifiable benefits for screening synthetic genetic circuits. The following table summarizes the key advantages and their magnitudes as reported in the literature.
Table 2: Quantitative Advantages of Microfluidic HTS Platforms
| Advantage | Metric | Comparison to Conventional Methods |
|---|---|---|
| Reagent & Cell Consumption | ~150-fold reduction in reagent use [38]. | Potential savings of ~$1–2 per datapoint on reagents alone [38]. Drastically reduced need for valuable primary cells. |
| Throughput (Droplet Mode) | Sample manipulation exceeding 500 Hz; up to 10^5 samples per day [39]. | Significantly higher than robotic liquid handling (<5 Hz) [39]. |
| Volume per Assay | 10^3 to 10^6-fold decrease in assay volume [39]. | Volumes in the pico- to nanoliter range, compared to microliters in well plates [39] [41]. |
| Parallelization (Valve-Based) | 20,160 droplet generators on a single 4-inch silicon chip [42]. | Represents a 100% increase over previously reported levels, enabling trillion particles/hour [42]. |
Experimental Protocol: Multi-Step Genetic Circuit Screening in an Integrated Valve-Based Device
This protocol details the operation of a polydimethylsiloxane (PDMS)-based microfluidic device with integrated valves for high-content screening of synthetic genetic circuits.
Materials and Reagents
Table 3: Research Reagent Solutions and Essential Materials
| Item | Function/Description | Critical Notes |
|---|---|---|
| PDMS Microfluidic Device | Platform for cell culture, stimulation, and staining. | Contains integrated membrane valves for fluid control [38]. |
| Cell Suspension | Cells harboring the synthetic genetic circuit to be tested. | Requires single-cell suspension for uniform loading [38]. |
| Induction Media | Contains chemical inducers (e.g., AHL, aTc) to activate the genetic circuit. | Prepared at different concentrations for dose-response studies. |
| Fixative (e.g., 4% PFA) | Arrests cellular processes and preserves molecular states. | Compatible with microfluidic channels and on-chip incubation. |
| Permeabilization Buffer | Enables intracellular antibody access. | Typically contains a detergent like Triton X-100. |
| Primary & Secondary Antibodies | Detect specific circuit outputs or endogenous markers. | Must be validated for immunostaining; fluorescent secondary antibodies for detection. |
| Wash Buffer (e.g., PBS) | Removes previous reagents between steps. | Essential for reducing background signal. |
Step-by-Step Procedure
- Device Priming: Flush all microfluidic channels with an appropriate cell culture medium to remove air bubbles and condition the surfaces for cell adhesion [38].
- Cell Loading: Introduce a single-cell suspension into the device's loading inlets. Actuate valves to gently guide and trap approximately 300 cells into each designated cultivation chamber [38].
- On-Chip Incubation & Circuit Induction:
- Allow cells to adhere and acclimatize under a continuous, slow flow of fresh medium for a pre-defined period (e.g., 6-24 hours).
- To induce the genetic circuit, switch the fluidic inputs using the valve manifold to expose the cells to medium containing the inducer. For complex dynamics, the device can be programmed to deliver pulses or gradients of the inducer [38].
- Fixation and Staining:
- Fixation: After the induction period, flow fixative through the chambers to halt all cellular activity. Incubate on-chip for 20-30 minutes.
- Permeabilization and Blocking: Flush with a permeabilization buffer, followed by a blocking buffer to prevent non-specific antibody binding.
- Immunostaining: Introduce the primary antibody solution and incubate on-chip. Wash thoroughly with buffer. Then, introduce the fluorescently-labeled secondary antibody solution, incubate, and perform a final wash [38].
- Imaging and Analysis: Place the entire device under a motorized microscope or high-throughput fluorescence scanner. Automatically acquire high-resolution images of each chamber. Use image analysis software to quantify fluorescence intensity, localization, and other morphological features at single-cell resolution [38].
Experimental Protocol: Ultra-High-Throughput Screening in Droplet Mode
This protocol is designed for screening large libraries of genetic circuit variants using droplet microfluidics.
Materials and Reagents
- Droplet Generation Chip: A microfluidic chip with a flow-focusing or T-junction geometry [39].
- Aqueous Phase: Contains the library of genetic circuit variants (e.g., in cells, yeast) suspended in culture medium, along with assay reagents.
- Oil Phase: A carrier fluid immiscible with the aqueous phase (e.g., fluorinated oil), typically containing surfactants for droplet stabilization [39] [40].
- Detection Reagents: Substrates or probes for a functional assay that generates a fluorescent signal (e.g., from a reporter gene activated by the circuit) [41].
Step-by-Step Procedure
- Droplet Generation and Encapsulation:
- On-Chip Incubation and Assay:
- Route the generated droplets through a long, serpentine channel or an off-chip incubation loop. This allows time for cell growth, circuit expression, and the enzymatic reaction to occur.
- For assays requiring additional steps, use pico-injection or droplet merging to introduce a second reagent, such as a substrate, into the pre-formed droplets after incubation [41].
- Detection and Sorting:
- As droplets flow in a single file past a laser-based detection point, measure the fluorescence signal of each droplet.
- Based on a pre-set fluorescence threshold, apply an electric field or other actuation mechanism to selectively deflect droplets containing the desired functional variants (positive hits) into a collection tube [41] [40].
- Downstream Analysis: Break the collected droplets to recover the encapsulated cells or genetic material for further validation, sequencing, or cultivation.
Workflow and System Diagrams
Integrated Valve-Based Screening Workflow
Droplet Microfluidic Screening Workflow
Programmable Fluid Control System
In the field of synthetic biology and metabolic engineering, biosensors are indispensable tools for high-throughput screening (HTS) of synthetic genetic circuits and optimizing microbial cell factories. These analytical devices combine a biological sensing element with a transducer to generate a measurable signal in response to a specific target analyte [43] [44]. For researchers and drug development professionals, optimizing biosensor performance is critical for efficient library screening in microfluidic systems, where dynamic regulation enables robust performance in fluctuating environments [45]. The effectiveness of a biosensor in these applications hinges on three core performance parameters: dynamic range, sensitivity, and response time.
- Dynamic Range refers to the span between the minimal and maximal detectable signals, defining the concentration window where the biosensor performs optimally [45].
- Sensitivity describes the lowest concentration of analyte that the biosensor can reliably detect, often reflected in the slope of the dose-response curve [45].
- Response Time is the speed at which the biosensor reacts to changes in analyte concentration, a critical factor for real-time monitoring and control [45].
This protocol details methods to quantify, tune, and optimize these key parameters, with specific application to microfluidic high-throughput screening platforms.
Performance Parameter Quantification and Analysis
Defining Key Performance Metrics
Table 1: Core Biosensor Performance Parameters and Their Definitions
| Parameter | Definition | Quantitative Measure | Importance in HTS |
|---|---|---|---|
| Dynamic Range | The span between the minimal and maximal detectable output signals [45]. | Ratio between maximum and minimum output signal (e.g., fluorescence intensity) [45]. | Determines the breadth of metabolite concentrations that can be detected in a library screen. |
| Operating Range | The concentration window of the analyte where the biosensor performs optimally [45]. | Concentration range between EC~10~ and EC~90~ from the dose-response curve. | Defines the usable detection window for a given biosensor in a screening campaign. |
| Sensitivity | The lowest concentration of analyte that the biosensor can reliably detect; the biosensor's responsiveness to analyte change [45]. | Response threshold and slope of the linear region of the dose-response curve. | Enables identification of low-producing variants and fine discrimination between library members. |
| Response Time | The speed at which the biosensor reaches its maximum output signal after analyte exposure [45]. | Time to reach a certain percentage (e.g., 90%) of the maximum steady-state signal. | Critical for real-time monitoring in dynamic processes and co-culture screening in droplets. |
| Signal-to-Noise Ratio | The clarity and reliability of the output signal compared to background variability [45]. | Ratio of the mean output signal to the standard deviation of the background signal. | Reduces false positives/negatives by ensuring output signals are distinguishable from noise. |
Establishing a Dose-Response Curve
The dose-response curve is the foundational dataset for characterizing biosensor performance. It maps the biosensor's output signal as a function of the analyte concentration [45].
Protocol:
- Preparation: Cultivate the biosensor strain in an appropriate medium to mid-exponential growth phase.
- Induction: Aliquot the culture into separate wells of a multi-well plate. Add a known concentration of the pure analyte (e.g., erythromycin, a target amino acid, or organic acid) to each well to create a concentration gradient. Include a negative control (no analyte).
- Incubation and Measurement: Incubate the plate under optimal growth conditions. Periodically measure the output signal (e.g., fluorescence using a plate reader) and the cell density (OD~600~) over time until the signal stabilizes.
- Data Analysis: For each analyte concentration, calculate the normalized output (e.g., fluorescence/OD~600~). Plot the normalized output against the analyte concentration. Fit a sigmoidal function (e.g., Hill equation) to the data to determine the EC~50~ (the concentration eliciting a half-maximal response), dynamic range, and operating range [45].
Engineering and Tuning Methodologies
Biosensor performance can be systematically tuned through genetic engineering to meet the specific requirements of a screening project.
Genetic Strategies for Parameter Tuning
Table 2: Engineering Strategies for Tuning Biosensor Performance
| Parameter | Engineering Target | Tuning Strategy | Expected Outcome |
|---|---|---|---|
| Dynamic Range & Sensitivity | Promoter Strength | Exchange the promoter driving the expression of the biosensor's transcription factor or reporter gene [45]. | Weaker promoters can increase sensitivity; stronger promoters may increase output ceiling. |
| Dynamic Range & Sensitivity | Ribosome Binding Site (RBS) | Modify the strength of the RBS for the transcription factor or reporter gene [45]. | Fine-tunes translation efficiency, directly affecting the dose-response relationship. |
| Dynamic Range & Sensitivity | Operator Region | Alter the number or position of the operator sequence (TF binding site) in the promoter [45]. | Modifies TF-binding affinity and cooperativity, impacting sensitivity and dynamic range. |
| Dynamic Range & Sensitivity | Plasmid Copy Number | Use vectors with different origins of replication to control biosensor component copy number [45]. | Higher copy numbers generally increase sensitivity but can create a trade-off with dynamic range. |
| Specificity | Ligand Binding Domain | Employ chimeric fusions of DNA and ligand-binding domains or use directed evolution [45]. | Alters or improves the biosensor's specificity for non-native analytes. |
| Response Time | System Modularity | Employ hybrid approaches, such as combining stable protein-based sensors with faster-acting riboswitches [45]. | Achieves a faster overall response while maintaining signal stability. |
High-Throughput Optimization via Directed Evolution
For tuning parameters that involve complex trade-offs, high-throughput methods are highly effective.
Protocol:
- Library Generation: Create a diverse library of biosensor variants by introducing random mutations in the transcription factor gene or its corresponding promoter/operator region using error-prone PCR or saturation mutagenesis.
- Screening: Use Fluorescence-Activated Cell Sorting (FACS) to screen the library.
- For dynamic range/sensitivity, sort cells into bins based on fluorescence intensity after induction with a sub-saturating analyte concentration.
- For reduced crosstalk, sort for low fluorescence in the absence of the analyte (low background) and high fluorescence in its presence [46].
- Validation: Isolate sorted cells, recover them, and characterize their dose-response curves using the protocol in Section 2.2 to identify improved variants.
Application in Microfluidic High-Throughput Screening
Integrating tuned biosensors into droplet microfluidic platforms dramatically enhances screening efficiency but introduces unique challenges, such as cell heterogeneity, which can lead to false positives [47].
Dual-Color Normalization for Enhanced Accuracy
A powerful strategy to mitigate the impact of variable cell density and gene expression noise in droplets is the use of a dual-color reporting system [47].
Protocol:
- Biosensor Design: Construct a biosensor strain that reports on the target analyte with a green fluorescent protein (GFP), while simultaneously expressing a constitutively expressed red fluorescent protein (mCherry) from a genomic location. The mCherry serves as an internal control for cell growth and metabolic activity [47].
- Droplet Generation and Cultivation: Co-encapsulate the biosensor strain with library variants (e.g., antibiotic-producing actinomycetes) in water-in-oil emulsion droplets using a microfluidic device. Incubate the droplets to allow for co-culture and metabolite production.
- Droplet Sorting and Analysis: As droplets flow through the sorter, measure both GFP and mCherry fluorescence for each droplet. Calculate a normalized output signal (e.g., GFP/mCherry ratio). This ratio cancels out variability caused by differences in cell number or general metabolic state [47].
- Variant Selection: Sort droplets based on this normalized ratio, rather than on raw GFP intensity. This method has been shown to yield a superior enrichment ratio and higher positive hit rates compared to single-color screening when applied to S. erythraea mutagenesis libraries for erythromycin overproduction [47].
The following workflow diagram illustrates this dual-color screening process:
The Scientist's Toolkit: Essential Reagents and Materials
Table 3: Key Research Reagent Solutions for Biosensor-based HTS
| Item | Function/Benefit | Example Application |
|---|---|---|
| Transcription Factor (TF)-based Biosensor | Core sensing machinery; provides specificity and converts metabolite concentration into genetic output [45] [46]. | High-throughput screening of metabolite-producing strain libraries in well plates or via FACS [46]. |
| Dual-Color Reporter System (GFP/mCherry) | Enables signal normalization; mCherry controls for cell growth/heterogeneity, GFP reports on analyte [47]. | Reducing false positives in droplet microfluidic screens by accounting for cell density variations [47]. |
| E. coli or Yeast Chassis | Well-characterized host organisms for biosensor implementation with extensive genetic toolkits [47]. | Reliable expression and function of genetically encoded biosensors for intracellular sensing. |
| Droplet Microfluidic Device (e.g., FADS) | Provides single-cell resolution and ultra-high-throughput screening capacity (thousands of droplets per second) [47]. | Co-culture screening of producer libraries and biosensor strains in picoliter-volume droplets. |
| Fluorescence-Activated Cell Sorter (FACS) | High-speed analysis and sorting of cells based on biosensor-reported fluorescence [46]. | Screening large libraries (e.g., from error-prone PCR or metagenomic libraries) for improved metabolite production. |
Troubleshooting Common Performance Issues
- Problem: High Signal-to-Noise Ratio. Excessive variability in output under constant conditions obscures true signal [45] [43].
- Solution: Implement the dual-color normalization protocol (Section 4.1). Ensure stable genomic integration of the biosensor circuit to minimize copy number variation, as opposed to using multi-copy plasmids [47].
- Problem: Slow Response Time. Delays in reaching maximum signal hinder real-time control and rapid screening [45].
- Solution: Engineer the biosensor by fusing the TF to degron tags for faster protein turnover. Explore the use of faster-responding RNA-based biosensors (riboswitches, toehold switches) as alternatives or hybrid components [45].
- Problem: Non-ideal Dynamic Range. The biosensor's operational window does not match the expected product concentration from your library [45] [46].
- Problem: False Positives in Droplet Screening. The screen identifies many hits that do not validate as true high-producers [47].
- Solution: The dual-color normalization method is specifically designed to address this. Additionally, re-screen sorted populations iteratively to enrich for true positives and confirm hits using gold-standard analytics like LC-MS [47].
The Role of Machine Learning and AI in Analyzing HTS Data and Predicting High-Performing Circuits
The field of high-throughput screening (HTS) for synthetic genetic circuits is undergoing a revolutionary transformation through the integration of artificial intelligence (AI) and machine learning (ML). As the complexity of genetic circuits increases, traditional experimental approaches face significant challenges in predictability and efficiency. The convergence of microfluidic technologies with advanced computational methods is creating new paradigms for accelerating the design-build-test-learn (DBTL) cycle in synthetic biology [48] [49].
AI-powered platforms now enable researchers to move beyond simple hit identification toward predictive engineering of cellular behaviors. This shift is critical because as circuit complexity grows, biological components demonstrate limited modularity and impose greater metabolic burden on host cells [16]. Modern HTS technologies address these limitations by combining microfluidic systems for single-cell analysis with ML algorithms that can identify subtle phenotypic patterns invisible to the human eye, thereby enabling the identification of rare variants and optimal circuit configurations with unprecedented accuracy [48] [50].
AI-Driven Analytical Frameworks for HTS Data
Machine Learning Applications in Phenotypic Screening
The volume and complexity of data generated by modern HTS platforms necessitate sophisticated AI-driven analytical frameworks. Microfluidic systems like the Digital Colony Picker (DCP) generate dynamic, single-cell resolution data on growth and metabolic phenotypes across thousands of parallel experiments [48]. ML algorithms excel at identifying multi-modal phenotypic signatures within these massive datasets, enabling the classification of circuit performance based on complex, non-intuitive patterns.
AI and machine learning are particularly valuable for pattern recognition in imaging data, helping researchers analyze complex images far more effectively than manual methods ever could [50]. These capabilities are transforming HTS from a simple hit-identification tool to a comprehensive predictive modeling platform. For genetic circuit engineering, ML models facilitate the analysis of circuit-host interactions, resource competition effects, and the emergence of context-dependent behaviors that often complicate traditional design approaches [49].
Table 1: Quantitative Performance of AI-Enhanced HTS Platforms
| Platform/Technology | Throughput Capacity | Key Performance Metrics | Reference Organism |
|---|---|---|---|
| Digital Colony Picker (DCP) | 16,000 addressable microchambers | Identified mutant with 19.7% increased lactate production, 77.0% enhanced growth | Zymomonas mobilis [48] |
| T-Pro Circuit Design Software | Enumeration of >100 trillion putative circuits | Quantitative predictions with average error below 1.4-fold for >50 test cases | Engineered E. coli [16] |
| Transcriptional Programming | 3-input Boolean logic (256 operations) | 4x smaller circuit size than canonical inverter-type circuits | Engineered E. coli [16] |
Data Management and Analysis Pipelines
The implementation of effective AI/ML workflows for HTS data requires specialized computational infrastructure. Tiered analytical approaches have emerged as best practices, beginning with broad, simple screens followed by deeper phenotyping for prioritized candidates [50]. These workflows incorporate quality control metrics such as z-factor calculation, data normalization procedures, and sophisticated hit identification algorithms that account for multiple performance parameters simultaneously [51] [52].
The integration of AI has also enabled more sophisticated experimental designs. For example, algorithmic enumeration methods can systematically explore combinatorial genetic spaces comprising >100 trillion putative circuits to identify optimally compressed designs [16]. These approaches model circuits as directed acyclic graphs and enumerate solutions in order of increasing complexity, guaranteeing identification of the most compressed circuit for a given truth table. This represents a fundamental shift from traditional trial-and-error optimization toward computationally-driven design.
Experimental Protocols and Methodologies
AI-Powered Microfluidic Screening Protocol
Protocol Title: High-Throughput Phenotypic Screening of Genetic Circuits Using AI-Enhanced Digital Colony Picker
Principle: This protocol describes an integrated workflow combining microfluidic compartmentalization, time-lapse imaging, and AI-driven image analysis to screen microbial strains expressing synthetic genetic circuits based on multi-modal phenotypes at single-cell resolution [48].
Materials and Equipment:
- Digital Colony Picker microfluidic chip (16,000 microchambers)
- PDMS mold layer with microstructures, ITO metal film layer, and glass layer
- High-precision temperature-controlled incubator
- Laser-induced bubble (LIB) export system
- AI-powered image analysis software
- Collection plate (96-well)
Procedure:
- Chip Preparation and Single-Cell Loading
- Pre-vacuum the microfluidic chip to remove air from microchambers
- Prepare a single-cell suspension of microbial strains harboring genetic circuits at optimal concentration (∼1×10⁶ cells/mL for 300 pL chambers)
- Introduce cell suspension into microchannels; residual air absorbed by PDMS layer ensures complete filling
- Incubate chip in water-filled centrifuge tube within temperature-controlled incubator to maintain saturated humidity
- Dynamic Monitoring and AI Analysis
- Capture time-lapse images of microchambers throughout incubation period
- Apply AI-driven image analysis to quantify single-cell morphology, proliferation, and metabolic activities
- Identify microchambers containing monoclonal colonies exhibiting target phenotypic signatures
- Target Export and Collection
- Inject oil phase into chip to facilitate droplet collection
- Precisely position laser focus at base of identified microchambers using motion platform
- Generate microbubbles via LIB technique to propel single-clone droplets toward outlet
- Collect exported clones into 96-well plate via capillary tube
- Adjust collection times in real-time based on droplet flow rates
Validation and Quality Control:
- Monitor liquid evaporation using fluorescent sodium solution; typical liquid loss rate should be <10% over experiment duration
- Perform all procedures in biosafety cabinet under sterile conditions to prevent contamination
- Verify single-cell distribution using Poisson distribution calculations (λ=0.3); optimize cell concentration to minimize multi-cell occupancy
Predictive Design of Compressed Genetic Circuits
Protocol Title: Computational Design of Minimal-Footprint Genetic Circuits Using T-Pro Software
Principle: This protocol details a wetware-software suite for the predictive design of compressed genetic circuits that implement higher-state decision-making with minimal genetic footprint, leveraging synthetic transcription factors and promoters [16].
Materials and Equipment:
- T-Pro circuit design software
- Orthogonal repressor/anti-repressor sets (e.g., CelR, LacI, RbsR)
- Synthetic promoter library
- Fluorescence-activated cell sorting (FACS) capability
- Standard molecular biology reagents
Procedure:
- Wetware Expansion and Characterization
- Engineer synthetic transcription factors responsive to orthogonal signals (e.g., cellobiose, IPTG, D-ribose)
- Generate anti-repressor variants via site saturation mutagenesis and error-prone PCR
- Screen variant libraries using FACS to identify optimal anti-repressors with desired dynamic range
- Characterize synthetic transcription factor-promoter pairs to establish input-output relationships
- Algorithmic Circuit Enumeration
- Define desired circuit function as truth table (e.g., 3-input Boolean logic with 8 states)
- Apply algorithmic enumeration method to identify optimally compressed circuit designs
- Model circuits as directed acyclic graphs, systematically enumerating by increasing complexity
- Select minimal-part implementation from solution space
- Quantitative Performance Prediction
- Account for genetic context effects in expression level quantification
- Apply predictive workflows to estimate circuit performance setpoints
- Validate predictions experimentally and refine models iteratively
Validation and Quality Control:
- For >50 test cases, achieve average prediction error below 1.4-fold
- Verify circuit compression (approximately 4x smaller than canonical designs)
- Validate circuit function across intended input state combinations
Visualization of Core Concepts
AI-Powered Screening Workflow
AI-Powered Digital Colony Picking Workflow
Predictive Circuit Design Process
Predictive Genetic Circuit Design Process
Essential Research Reagent Solutions
Table 2: Key Research Reagents and Materials for AI-Enhanced HTS
| Reagent/Material | Function/Application | Key Characteristics |
|---|---|---|
| Microfluidic Chips (16,000 chambers) | Single-cell compartmentalization and cultivation | Picoliter-scale microchambers, gas-phase isolation, ITO film layer for LIB [48] |
| Orthogonal Transcription Factor Sets | Implementation of Boolean logic in genetic circuits | Responsive to orthogonal signals (cellobiose, IPTG, D-ribose), engineered anti-repressors [16] |
| Synthetic Promoter Libraries | Tunable control of gene expression in circuits | Tandem operator designs, compatible with synthetic transcription factors [16] |
| Dual-Fluorescence Reporter Systems | Simultaneous monitoring of circuit function and cytotoxicity | EYFP/ECFP pairs, enables false-positive minimization in screening [15] |
| T-Pro Circuit Design Software | Algorithmic enumeration of compressed genetic circuits | Directed acyclic graph modeling, guarantees minimal-part solutions [16] |
| AI-Powered Image Analysis Software | Phenotypic classification and target identification | Multi-parametric analysis, single-cell resolution, dynamic monitoring [48] |
The integration of AI and ML with HTS for synthetic genetic circuits represents a fundamental shift in how researchers approach biological design. The technologies described herein—from AI-powered microfluidic platforms to predictive circuit design software—are enabling unprecedented precision in genetic circuit engineering. These approaches directly address core challenges in synthetic biology, including context dependence, modularity limitations, and the escalating metabolic burden of complex circuits [49] [16].
Looking forward, the field is moving toward increasingly integrated digital-biological workflows. AI is expected to enhance modeling at every stage, from target discovery to virtual compound design, potentially reducing wet-lab screening requirements through more accurate in silico predictions [50]. The development of organoid-on-chip systems that connect different tissues will enable drug screening in miniaturized human-like environments, while adaptive screening approaches with AI deciding in real-time which compounds or doses to test next will further accelerate the DBTL cycle [50]. As these technologies mature, they will continue to transform HTS from a largely empirical process to a predictive engineering discipline, ultimately enabling more rapid development of sophisticated genetic circuits for biomedical and industrial applications.
The expansion of synthetic biology into diverse chassis organisms presents a fundamental challenge: optimizing genetic circuits and systems in new cellular environments often requires extensive, costly, and time-consuming re-screening. Transfer learning offers a powerful solution to this bottleneck by leveraging knowledge gained from well-characterized model organisms to accelerate the optimization of biological systems in novel, less-characterized chassis. This approach is particularly valuable in high-throughput screening (HTS) of synthetic genetic circuits using microfluidics, where it can dramatically reduce the experimental burden required to achieve functional systems.
Recent advances in microfluidics enable the creation of picoliter droplet reactors, allowing for massive combinatorial screening of biochemical conditions at unprecedented scales [53]. However, when changing the chassis organism—for instance, moving from Escherichia coli to Bacillus subtilis—the optimal composition of supporting systems like cell-free gene expression (CFE) often changes, traditionally necessitating complete re-screening. Transfer learning addresses this by using machine learning models trained on data from a source chassis, which are then fine-tuned with minimal target chassis data to predict high-performance formulations [53]. This protocol details the application of transfer learning to adapt screening models across biological chassis, specifically within the context of microfluidic-based HTS for synthetic biology.
Key Concepts and Definitions
- Source Chassis: The well-characterized organism (e.g., E. coli) from which initial data and a pre-trained model are derived.
- Target Chassis: The novel or less-characterized organism (e.g., B. subtilis) for which a new, optimized system is desired.
- Transfer Learning: A machine learning technique where a model developed for a source task is reused as the starting point for a model on a target task, requiring less target data.
- Cell-Free Gene Expression (CFE): An in vitro transcription-translation system using crude cellular extracts, bypassing the need to maintain living cells [53].
- Droplet-Based Microfluidics: A high-throughput technology that uses picoliter-sized aqueous droplets suspended in oil as independent bioreactors for screening [53].
Experimental Design and Workflow
The following workflow diagrams the complete process of applying transfer learning to adapt a screening model from a source chassis to a target chassis.
High-Throughput Data Collection in Source Chassis
Required Materials and Reagents
Research Reagent Solutions
Table 1: Essential Research Reagents and Materials
| Item | Function/Description | Example/Notes |
|---|---|---|
| Source Chassis Cell Extract | Provides the core transcriptional/translational machinery for the base system. | E. coli lysate is commonly used as the source chassis [53]. |
| Target Chassis Cell Extract | The novel chassis system to be optimized. | Bacillus subtilis lysate [53]. |
| Energy Source Molecules | Fuel the CFE reactions (e.g., transcription, translation). | Typically a combination of nucleotides (e.g., ATP, GTP) and secondary energy sources [53]. |
| Transcription-Translation Factors | Additives that enhance or are essential for CFE efficiency. | Coenzyme A, NAD, exogenous tRNAs [53]. |
| Reporter Plasmid DNA | Encodes a measurable output (e.g., fluorescent protein) to quantify system performance. | Plasmid encoding superfolder Green Fluorescent Protein (sfGFP) [53]. |
| Fluorescent Dyes | Used for color-coding droplets to trace their unique composition. | Enable the "FluoreCode" system for high-throughput deconvolution [53]. |
| Microfluidic Device & Surfactant | Generates and stabilizes picoliter droplet reactors. | PEG-PFPE surfactant in fluorinated oil [53]. |
Step-by-Step Protocol
Protocol 1: Base Model Generation in Source Chassis
This protocol generates the foundational dataset and machine learning model from the source chassis.
Preparation of Source Chassis Extract:
- Culture the source chassis cells (e.g., E. coli) to mid-log phase.
- Harvest cells via centrifugation and lyse using a validated method (e.g., bead beating, sonication).
- Clarify the lysate by centrifugation to remove cell debris. Aliquot and flash-freeze the extract in liquid nitrogen. Store at -80°C.
Combinatorial Library Formulation & Droplet Generation:
- Design a library that varies key CFE components (e.g., energy sources, transcription-translation factors) at different concentrations.
- Use a microfluidic device to generate the droplet library. The carrier droplet contains the source chassis extract and reporter DNA. Satellite droplets, each containing a unique set of components, are merged with the carrier droplet.
- Encode each satellite droplet's composition with a unique fluorescent color and intensity ("FluoreCode").
In-Droplet Incubation and Screening:
- Collect the emulsion and incubate at the appropriate temperature (e.g., 30-37°C) for a set period (e.g., 4-6 hours) to allow for gene expression.
- After incubation, image the droplets using a multi-channel fluorescence microscope to measure the output (e.g., sfGFP fluorescence) and read the FluoreCode to identify the composition of each droplet.
Model Training:
- Curate the dataset, linking each FluoreCode (input condition) to its corresponding output intensity.
- Train a machine learning model (e.g., Random Forest, Gradient Boosting) to predict the system's output (yield) based on the input components and their concentrations. This model is the Base Model.
Protocol 2: Model Transfer and Validation in Target Chassis
This protocol adapts the base model to a new target chassis with minimal experimental effort.
Target Chassis Initial Screening:
- Prepare a limited combinatorial set (e.g., 27-36 combinations) using the target chassis extract (e.g., B. subtilis lysate).
- Use the same microfluidic and FluoreCode system from Protocol 1 to screen this limited set and obtain input-output data.
Transfer Learning Execution:
- Use the limited target chassis dataset to fine-tune the pre-trained base model.
- The transfer learning algorithm retains the general relationships learned from the source chassis but adjusts its parameters to better fit the specific response of the target chassis.
In Silico Prediction & Validation:
- Use the fine-tuned model to predict high-yield combinations within the target chassis that were not experimentally tested.
- Select the top predicted combinations and perform physical validation experiments in the target chassis using the microfluidic platform or bulk reactions.
- Compare the predicted yields with the experimentally observed yields to confirm model accuracy and utility.
Data Analysis and Interpretation
Key Performance Metrics
Table 2: Quantitative Validation of a Transfer Learning Approach for CFE Optimization
| Metric | Source Chassis (E. coli) | Target Chassis (B. subtilis) | Notes |
|---|---|---|---|
| Screening Scale for Base Data | ~500 combinations [53] | 27-36 combinations [53] | Drastic reduction in experimental burden. |
| Model Prediction Error (Avg.) | < 1.4-fold error for >50 test cases [16] | High accuracy with limited input [53] | Model maintains reliability post-transfer. |
| Yield Improvement | 1.9-fold increase in sfGFP yield [53] | 2-fold increase in sfGFP yield [53] | Successful optimization in target chassis. |
| Cost Reduction | 2.1-fold decrease in unit cost [53] | Data not specified | Simplified formulations reduce cost. |
| Component Reduction | 4-fold reduction in genetic part count [16] | 3 essential additives selected [53] | Achieves simpler, more efficient systems. |
The data in Table 2 demonstrates the efficacy of transfer learning. The model trained extensively on E. coli data could be adapted to B. subtilis using only 27-36 data points, successfully predicting formulations that doubled the protein yield. This resulted in a significantly simplified and more cost-effective system for the target chassis, mirroring the success in the source chassis.
Troubleshooting
Table 3: Common Issues and Recommended Solutions
| Problem | Potential Cause | Solution |
|---|---|---|
| Poor predictive performance of the transferred model. | Source and target chassis are too biologically dissimilar. | Increase the size of the target chassis training dataset. Consider using a different, more phylogenetically similar source chassis. |
| Low dynamic range in output signal (e.g., fluorescence). | Reporter protein not optimal or CFE reaction is inefficient. | Validate the reporter system in a bulk reaction first. Ensure cell extract quality and optimize basic reaction conditions (salt, Mg2+). |
| High droplet coalescence or instability. | Incorrect surfactant concentration or oil phase. | Prepare fresh surfactant stock and ensure proper emulsification. Check flow rates on the microfluidic device. |
| Inaccurate FluoreCode decoding. | Fluorescence intensity outside the linear range or channel bleed-through. | Titrate fluorescent dye concentrations and adjust microscope exposure settings and emission filters. |
Benchmarking Success: Validation, Cost-Benefit Analysis, and Clinical Translation
High-throughput screening (HTS) of synthetic genetic circuits using droplet microfluidics represents a transformative approach in synthetic biology and drug development. This technology enables the rapid analysis of thousands to millions of unique samples per day by encapsulating individual genetic circuits within picoliter to nanoliter droplets, each serving as an isolated microreactor [25]. The compartmentalization of reactions within these droplets allows for a significant reduction in reagent volumes—achieving a remarkable (10^3) to (10^6)-fold volume reduction compared to conventional bulk workflows—while simultaneously providing robust physical containment that minimizes cross-contamination and surface fouling [25] [40]. This application note details a comprehensive protocol for the validation of hits, beginning with the initial collection of droplet-based microfluidic screens and progressing through to bulk characterization, all framed within the context of screening complex genetic circuits. The methodologies outlined are designed to bridge the gap between ultra-high-throughput primary screening and the rigorous secondary validation necessary for confirming hit candidates, with a particular emphasis on techniques suitable for synthetic genetic circuits operating within synthetic minimal cells (synells) [54].
Quantitative Characterization of the Screening Assay
Before initiating a high-throughput screen, it is critical to quantitatively evaluate the performance and suitability of the assay itself. A key statistical parameter for this assessment is the Z-factor, a dimensionless screening window coefficient that reflects both the assay signal dynamic range and the data variation associated with the signal measurements [55].
Table 1: Key Parameters for HTS Assay Quality Assessment
| Parameter | Description | Interpretation | Target Value |
|---|---|---|---|
| Z-factor | A reflection of both the assay signal dynamic range and the data variation [55]. | An ideal assay for HTS. | ( Z \geq 0.5 ) |
| A marginal assay which might be optimized. | ( 0 < Z < 0.5 ) | ||
| The assay has a small or no window. | ( Z \leq 0 ) |
A well-optimized assay with a Z-factor of 0.5 or greater is considered excellent for robust hit identification, providing a sufficient window to distinguish true signals from background noise with high confidence [55].
Protocols for Droplet Collection and Primary Hit Identification
Generation and Incubation of Droplet Libraries
The workflow begins with the encapsulation of synthetic genetic circuit components into monodisperse droplets.
- Droplet Generation: Utilize a standard flow-focusing or T-junction microfluidic geometry to generate water-in-oil emulsions. The continuous oil phase should be supplemented with 0.5-2% (w/w) biocompatible surfactant (e.g., PEG-PFPE block copolymers) to ensure droplet stability and prevent coalescence [25]. For synthetic genetic circuits, the dispersed aqueous phase contains the cell-free transcription-translation (TX-TL) system (e.g., HeLa or E. coli extract), DNA encoding the genetic circuit, and any necessary reagents. Typical droplet volumes range from picoliters to nanoliters, generated at frequencies exceeding 500 Hz [25] [54].
- Library Construction for Combinatorial Screening: To create combinatorial libraries, employ droplet pairing and merging strategies. Generate two separate droplet libraries, each containing different circuit components or inducer molecules. Combine the streams in a microfluidic device to pair droplets in a one-to-one manner, followed by electrocoalescence to merge them, thereby creating a deterministic combination of the original droplets [25] [54].
- On-chip Incubation: For short-term incubation (minutes to hours), integrate a delay line on the microfluidic device. This can be a long, serpentine channel, often with an expanded volume or a multi-layer fabrication design to increase droplet containment and reduce fluidic velocity, allowing more on-device time for gene expression and circuit function [25].
On-chip Detection and Sorting of Primary Hits
Following incubation, droplets are analyzed in-flow to identify hits based on the output of the synthetic genetic circuit, typically a fluorescent protein (e.g., GFP) or a luminescent readout (e.g., luciferase).
- Detection: Pass droplets single-file through a laser-induced fluorescence (LIF) detection zone. For secreted enzymes or metabolites, incorporate fluorogenic substrates into the droplet during generation [40]. Absorbance and Raman spectroscopy are also compatible detection modalities that broaden the range of screenable phenotypes [40].
- Sorting via Dielectrophoresis (DEP): Upon detection of a desired signal, activate an electric field for DEP-based sorting. A common method uses electrodes integrated into the microfluidic device downstream of the detection point. When a hit droplet is detected, a high-voltage AC field is briefly applied, deflecting the target droplet into a separate collection channel while non-hits continue to the waste stream. This method allows for sorting at rates of up to several hundred Hz [25] [40].
Protocols for Bulk Characterization of Validated Hits
The droplets collected from the primary screen contain validated hits that require further, more rigorous characterization in bulk to confirm their function and properties. This phase is critical for triaging false positives and establishing structure-activity relationships [56] [57].
Breaking Emulsions and Recovery
Carefully break the water-in-oil emulsion to recover the aqueous content of the sorted droplets for downstream analysis.
- Protocol: Transfer the collected droplet suspension to a microcentrifuge tube. Add an equal volume of water-saturated ethyl acetate or 1H,1H,2H,2H-perfluoro-1-octanol (PFO). Vortex vigorously for 30-60 seconds. Centrifuge at 10,000 × g for 2 minutes to separate the phases. The aqueous phase containing the genetic circuit and its products will be at the bottom of the tube and can be carefully pipetted for subsequent use [40].
Hit Validation Cascade
Employ a cascade of biophysical and biochemical assays to validate target engagement and elucidate the mechanism of action.
Table 2: Key Reagent Solutions for Hit Validation
| Research Reagent / Assay | Function in Hit Validation |
|---|---|
| Cell-free TX-TL Systems | Provides the machinery for transcription and translation outside a living cell, essential for expressing and testing genetic circuits in vitro [54]. |
| Surface Plasmon Resonance (SPR) | A label-free technique to demonstrate direct target engagement and measure binding affinity ((K_D)) and kinetics (association/dissociation rates) [56] [57]. |
| Isothermal Titration Calorimetry (ITC) | The gold-standard label-free method for affinity determination, providing a full thermodynamic profile of the binding interaction ( (K_D), ΔH, ΔS, stoichiometry) [56] [57]. |
| Differential Scanning Fluorimetry (DSF) | A high-throughput method detecting thermal stabilisation ((\Delta T_m)) of a protein target as a result of ligand binding, useful for qualitative triaging [57]. |
| Cellular Thermal Shift Assay (CETSA) | An adaptation of DSF to evaluate target engagement by a compound in intact cells, providing evidence of binding in a more physiologically relevant environment [57]. |
Validation of Target Engagement:
- Surface Plasmon Resonance (SPR): Immobilize the target protein on an SPR chip. Use a 384-well compatible system to screen the binding of recovered hits in a medium-throughput format. This technique directly measures binding affinity ((KD)) and kinetics ((k{on}), (k_{off})) [57].
- Isothermal Titration Calorimetry (ITC): For a smaller set of high-priority hits, perform ITC. This technique measures the heat change upon binding, providing a full thermodynamic profile ((K_D), ΔH, ΔS, stoichiometry) of the interaction without requiring labeling [56] [57].
- Cellular Thermal Shift Assay (CETSA): Apply CETSA to confirm that the hit engages with the intended target inside a live cell, providing critical evidence of cell membrane permeability and intracellular target engagement [57].
Elucidating Mechanism of Inhibition/Action:
- Mechanism of Inhibition Assay: For enzymatic targets, characterize the mode of inhibition by measuring the IC~50~ of the hit at multiple different substrate concentrations. Analyze the effect on (Km) and (V{max}) to determine if the inhibition is competitive, uncompetitive, or non-competitive [57].
- Reversibility Testing: Distinguish between reversible and irreversible (covalent) binders. Pre-incubate the target enzyme with a high concentration of the hit to saturate binding sites. Then, rapidly dilute the mixture 100-fold and measure the recovery of enzymatic activity over time. Rapid recovery indicates reversible binding, while little to no recovery suggests covalent modification [57].
High-Throughput Screening (HTS) is a foundational methodology in modern drug discovery and synthetic biology, enabling the rapid testing of thousands of chemical or genetic compounds against biological targets. The primary goal of HTS is to accelerate the identification of active compounds, validate drug targets, and advance hit-to-lead development through automated, miniaturized experimental systems [58]. Traditional HTS has predominantly relied on multi-well plate formats (96-, 384-, or 1536-well plates) with automated liquid handling and detection systems [59]. These systems facilitate the screening of large compound libraries by relying on robotics for liquid and plate handling, sensitive detectors, and sophisticated data processing software [59].
In recent years, microfluidic technology has emerged as a transformative platform for HTS, offering the potential for unprecedented miniaturization and automation. Microfluidic HTS, often called "lab-on-a-chip," manipulates fluids and particles at the micron scale, enabling dramatic reductions in reagent consumption and providing superior control over the cellular microenvironment [38] [59]. For researchers focused on the high-throughput screening of synthetic genetic circuits, the choice between these two platforms involves critical trade-offs in throughput, cost, biological relevance, and experimental flexibility. This application note provides a detailed comparison of these technologies, with specific protocols for their implementation in advanced genetic research.
Quantitative Comparison: Microfluidics vs. Well-Plates
The table below summarizes the key performance characteristics of microfluidic and well-plate HTS platforms, highlighting critical differences that impact experimental design and resource allocation.
Table 1: Performance and Cost Comparison of HTS Platforms
| Parameter | Conventional Well-Plates | Microfluidic HTS |
|---|---|---|
| Typical Assay Volume | 10-100 µL (384-well) [59] | Picoliters to nanoliters [38] [2] |
| Reagent Consumption | High | 150-fold lower than conventional HTS [38] |
| Relative Cost Savings | Baseline | ~$1-2 per data point on reagents alone [38] |
| Throughput (Theoretical) | Up to millions of compounds [51] | ~1,000,000 combinations/hour (DropAI platform) [2] |
| Cellular Microenvironment Control | Limited in standard formats | High precision, enables complex dynamic stimuli [38] [59] |
| Physiological Relevance | Standard 2D culture; 3D models possible | High, with advanced 3D tissue/organoid models [60] |
| Primary Cell Usage Efficiency | Low, requires subculturing | High, enables direct use of valuable primary cells [38] |
| Temporal Experiment Capability | Limited by manual fluid changes | Excellent, permits complex time-varying stimuli [38] |
| Key Application Strength | Large-scale library screening | Functional genomics, pathway analysis, complex temporal studies [61] [38] |
Experimental Protocols for Synthetic Genetic Circuit Screening
Protocol 1: Microfluidic High-Content Screening for Genetic Circuit Dynamics
This protocol is adapted from a published microfluidic platform for high-content, time-resolved screening of cell signaling and gene expression [38]. It is ideal for characterizing the dynamics of synthetic genetic circuits under precise environmental control.
Research Reagent Solutions
Table 2: Essential Materials for Microfluidic HTS
| Item | Function | Example/Note |
|---|---|---|
| PDMS Device | Microfluidic chip for cell culture and assay | Polydimethylsiloxane (PDMS), bio-compatible and optically transparent [38] |
| Integrated Membrane Valves | Controls fluid flow to compartments | Actuated to expose cells to different factors [38] |
| Liquid Handling System | For loading cells, media, drugs, and stains | Automated system for precise fluid control [38] |
| Crude Cellular Extracts | For cell-free gene expression (CFE) systems | E. coli or B. subtilis extracts [2] |
| Fluorescent Reporter Plasmid | Visualizes genetic circuit output | e.g., plasmid encoding superfolder GFP (sfGFP) [2] |
| Antibodies / Staining Reagents | Immunochemical staining of targets | For fixed-cell endpoint analysis [38] |
| Fluorinated Oil & Surfactant | Creates stable emulsion for droplet-based assays | PEG-PFPE surfactant, Poloxamer 188 [2] |
Procedure
- Device Preparation: Fabricate the microfluidic device from PDMS using standard soft lithography. The design should feature multiple compartments (e.g., 32) linked to inlets and outlets, controlled by integrated membrane valves [38].
- Cell Loading: Introduce a suspension of cells containing the synthetic genetic circuit into the device. Load approximately 300 cells into each compartment for a total of nearly 10,000 individual experiments per device [38].
- Circuit Stimulation and Dynamic Control: Use the automated valve system to expose each compartment to a different combination or concentration of inducers or small-molecule inhibitors. The microfluidic system allows for the application of complex temporal inputs (e.g., periodic pulses, gradually decreasing stimuli) to mimic in vivo conditions [38].
- Fixation and Staining (Endpoint Analysis): At the conclusion of the experiment, flush the device with a fixative (e.g., paraformaldehyde) to preserve cellular states. Subsequently, perform immunocytochemical staining within the device to detect specific signaling proteins or circuit outputs [38].
- Imaging and Analysis: Image the cells using a motorized microscope or high-content scanner. Use automated image analysis software to quantify reporter fluorescence, protein localization, and other phenotypic readouts at single-cell resolution [38].
Workflow Visualization
Diagram 1: Microfluidic HTS workflow for dynamic analysis of genetic circuits.
Protocol 2: AI-Driven Droplet Screening for Cell-Free Genetic Circuit Optimization
This protocol utilizes the DropAI strategy, an AI-driven, droplet-based microfluidic platform for high-throughput optimization of cell-free gene expression (CFE) systems, which are ideal for prototyping synthetic genetic circuits [2].
Procedure
- Droplet Library Generation: Use a microfluidic device to generate a library of picoliter-scale droplets (~250 pL). The system creates merged droplets where a central "carrier" droplet (containing the CFE mix) combines with multiple "satellite" droplets, each containing a unique set of CFE components (e.g., energy sources, nucleotides, cofactors) [2].
- Fluorescent Color-Coding (FluoreCode): Encode the composition of each merged droplet using a fluorescent color and intensity barcode system. Image the droplets under multiple channels to decode the specific combination of components in each droplet reactor [2].
- In-droplet Incubation and Expression: Incubate the emulsion to allow for cell-free gene expression of the reporter protein (e.g., sfGFP) from the genetic circuit template within the droplets.
- High-Throughput Measurement: Measure the fluorescence output of each droplet to quantify genetic circuit activity across thousands of different combinatorial conditions in parallel.
- In Silico Optimization with Machine Learning: Use the experimental data (FluoreCode and corresponding output) to train a machine learning model. The model predicts the contribution of each component and suggests new, high-performing combinations that were not tested experimentally [2].
- Model Validation and Iteration: Validate the top predictions from the model in the droplet system. Use these results to refine the model further, ultimately leading to an optimized, simplified CFE formulation for the genetic circuit of interest [2].
Workflow Visualization
Diagram 2: AI-driven droplet screening workflow for optimizing genetic circuits in cell-free systems.
Protocol 3: Well-Plate-Based Primary Screening of Genetic Circuit Libraries
This protocol outlines a standard well-plate-based HTS campaign, suitable for the initial, large-scale screening of vast genetic circuit variant libraries.
Procedure
- Assay Design and Miniaturization: Develop a robust assay, typically in a 384- or 1536-well plate format. The assay should be validated using key performance metrics, including a Z'-factor > 0.5, indicating an excellent assay for HTS [58].
- Automated Liquid Handling: Use robotic liquid handling systems to dispense assay components, cells, and the library of genetic circuit variants into the microplates.
- Incubation and Induction: Incubate the plates under controlled conditions (e.g., temperature, CO₂) to allow for cell growth and circuit induction.
- Endpoint or Kinetic Reading: Measure the circuit output using a plate reader. Detection methods can include fluorescence, luminescence, absorbance, or more complex high-content imaging [58].
- Hit Identification and Analysis: Process the data to identify "hits"—variants that produce the desired phenotypic or reporter output. Perform post-HTS analysis, such as calculating IC₅₀ values or structure-activity relationships (SAR), to prioritize leads for further characterization [58].
Discussion and Concluding Recommendations
The choice between microfluidic and well-plate HTS platforms is not a simple matter of superiority but depends heavily on the specific research goals and constraints.
- For Maximum Throughput and Cost-Efficiency on Large Libraries: Well-plate systems remain the established workhorse for primary screening campaigns involving hundreds of thousands to millions of compounds or genetic variants [51] [58]. Their strength lies in straightforward scalability and established workflows.
- For Enhanced Physiological Relevance and Complex Dynamics: Microfluidic HTS excels in applications requiring precise microenvironment control, minimal reagent consumption, and the ability to perform complex temporal stimulation. It is the preferred platform for secondary screening, functional validation, and detailed mechanistic studies on a smaller number of high-priority hits, especially when using valuable primary cells or complex 3D models like organ-on-chip systems [38] [60].
- For Rapid Optimization and AI Integration: The emerging generation of AI-driven droplet microfluidics, as exemplified by the DropAI platform, offers a powerful hybrid approach. It combines the ultra-high throughput of miniaturization with the predictive power of machine learning, making it ideally suited for optimizing complex systems like cell-free genetic circuits and accelerating the design-build-test cycle [2].
In the context of a thesis on synthetic genetic circuits, a synergistic approach is recommended. Researchers can leverage the strengths of each platform at different stages: using well-plate HTS for initial library screening, and subsequently applying microfluidic platforms for in-depth characterization and optimization of leading circuit designs under dynamically controlled conditions.
The development of microbial cell factories for efficient chemical synthesis is often limited by low production yields and high unit costs, with metabolic burden and context-dependence presenting major obstacles to robust performance [62] [63]. Traditional methods for strain improvement involve labor-intensive, low-throughput screening that prolongs development cycles. However, integrated platforms combining microfluidic high-throughput screening with synthetic genetic circuits are now enabling unprecedented efficiency in biocatalyst optimization [25] [53] [63]. This protocol details the application of these advanced methodologies to quantitatively achieve two primary objectives: a significant reduction in the unit cost of a target product and a concomitant increase in product yield. We focus on the practical implementation of droplet microfluidics and auto-optimizing genetic circuits, providing detailed application notes for researchers in synthetic biology and drug development.
Key Technological Platforms
High-Throughput Screening Platforms
The following table summarizes the core microfluidic platforms that form the basis of the high-throughput screening protocols described in this document.
Table 1: Comparison of High-Throughput Screening Platforms
| Platform Name | Core Principle | Throughput/Screening Scale | Key Quantitative Outcome | Reference |
|---|---|---|---|---|
| DropAI | Droplet-based microfluidics combined with AI-guided modeling | ~1,000,000 combinations/hour; 50,000 droplets in ~3 minutes | 4-fold unit cost reduction, 1.9-fold yield increase for sfGFP | [53] |
| CFPU | Microfluidic chip with 280 programmable chemostats for steady-state tx-tl | 280 individual chemostats | Enables analysis of dynamic circuits under sustained steady-state conditions | [1] |
| HTS for A. oryzae | Large-diameter (290 µm) droplet screening for filamentous fungi | 350 droplets/minute; 450,000 droplets screened in 2 weeks | 6.6-fold increase in α-amylase production | [64] |
Synthetic Genetic Circuits for Optimization
Genetic circuits provide a powerful, genetically encoded means to dynamically control metabolic fluxes without external intervention. The table below categorizes key circuit types used for optimization.
Table 2: Types of Genetic Circuits for Metabolic Optimization
| Circuit Type/Function | Key Components | Mechanism of Action | Impact on Yield & Cost |
|---|---|---|---|
| Dynamic Regulation | Metabolite-responsive biosensors, promoters [63] | Balances cell growth and product synthesis; decouples production from burden | Increases overall titer and volumetric yield, lowering unit cost |
| Feedback Optimizer | Synthetic genetic feedback module [62] | Automatically adjusts production of regulator species to maximize a performance proxy (e.g., fluorescence) | Tracks time-varying optimum, maintaining peak yield in fluctuating environments |
| High-Throughput Biosensor | Transcription factor-based repressors, fluorescent reporters [1] [63] | Links product concentration to measurable signal (fluorescence) for sorting | Enables direct screening of overproducing variants from vast libraries |
Application Note: DropAI for Cell-Free System Optimization
The DropAI platform integrates microfluidic droplet screening with machine learning to streamline and optimize complex biochemical systems, such as cell-free gene expression (CFE) formulations [53]. The following diagram illustrates the core workflow of this approach.
Diagram 1: The DropAI screening and optimization workflow.
Quantitative Outcomes from CFE System Optimization
Application of the DropAI platform to an E. coli-based CFE system yielded the following quantitative results.
Table 3: Quantitative Outcomes from DropAI Optimization of a CFE System [53]
| Performance Metric | Original CFE Formula | DropAI-Optimized Formula | Relative Change |
|---|---|---|---|
| Number of Additives | ~40 additional components | 3 essential additives | 92.5% reduction |
| sfGFP Unit Cost | Baseline | 2.1-fold decrease | 52.4% reduction |
| sfGFP Yield | Baseline | 1.9-fold increase | 90% increase |
| Validation (12 Proteins) | - | 10/12 proteins showed maintained or increased yield | - |
Detailed Experimental Protocol
Part 1: Microfluidic Library Construction and Screening
Materials:
- Microfluidic Device: Fabricated for droplet generation and merging (see Reagent Solutions).
- Continuous Phase: Novec 7500 oil with 2% (w/w) PEG-PFPE biocompatible surfactant [53] [64].
- Aqueous Phases:
- Carrier Droplets: E. coli lysate, DNA template for sfGFP, and core CFE buffer.
- Satellite Droplets: Libraries of CFE additives (e.g., nucleotides, cofactors, energy substrates) prepared in separate pools.
- Fluorescent Dyes: For FluoreCode system (e.g., FITC, Cy5, R-PE).
Procedure:
- Droplet Generation: Generate carrier droplets containing the basic CFE mix at a flow rate of 5 µL/min, with the oil phase flowing at 60 µL/min to produce droplets of ~80 µm diameter [53] [64].
- Satellite Droplet Generation: Simultaneously generate three streams of satellite droplets, each containing a unique library of CFE additives. Each component in a library is associated with a specific fluorescent color and intensity (FluoreCode).
- Droplet Pairing and Merging: Synchronize the flow of carrier and satellite droplets so that each carrier droplet sequentially pairs with three satellite droplets. Direct the grouped droplets through a micro-teeth merger structure to form complete screening units. Efficiency should exceed 90%.
- Incubation: Collect the emulsions and incubate at 30°C for 4-6 hours to allow for protein expression.
- Imaging and Analysis: Image droplets using a multi-channel fluorescence microscope.
- Measure sfGFP fluorescence in the green channel (output signal).
- Read the FluoreCode in parallel using other fluorescence channels to decode the specific combination of additives in each droplet.
- Data Compilation: Compile a dataset linking each unique combinatorial FluoreCode to its corresponding sfGFP yield.
Part 2: In Silico Optimization and Validation
Materials:
- Computer with appropriate machine learning libraries (e.g., scikit-learn, TensorFlow).
- Standard molecular biology reagents for in vitro validation.
Procedure:
- Model Training: Use the experimental dataset (from Step 6 above) to train a machine learning model (e.g., Random Forest or Gradient Boosting) to predict CFE yield based on the presence and concentration of additives.
- Prediction and Selection: Use the trained model to predict the yield of thousands of virtual combinations. Select the top 5-10 predicted high-yield combinations for validation.
- In Vitro Validation: Prepare the selected CFE formulations in bulk (e.g., 100 µL reactions) and express sfGFP.
- Quantify sfGFP yield using a fluorescence plate reader.
- Compare yields and costs against the original formulation.
- Secondary Validation: Express a panel of 12 different proteins (molecular weights from 27 to 370 kDa) in the top-performing optimized formulation to assess its generalizability [53].
Application Note: A Genetic Feedback Optimizer for Dynamic Control
For in vivo applications, a synthetic genetic feedback optimizer can be implemented to dynamically regulate metabolic fluxes, balancing cell growth and product synthesis to maximize yield [62] [63]. The core mechanism is outlined below.
Diagram 2: Architecture of the synthetic genetic feedback optimizer.
Quantitative Framework and Expected Outcomes
This optimizer implements an approximate gradient ascent. The controller adjusts the concentration of the regulator species (x) by comparing the changes in the regulator (Δx) and the performance reporter (Δy) over a short time delay [62]. The control law is:
- Increase x if (x is increasing AND y is increasing) OR (x is decreasing AND y is decreasing).
- Decrease x otherwise.
This dynamic regulation allows the system to locate and track the optimal setpoint x* that maximizes the performance function F(x, θy), even as parameters shift. Successful implementation in E. coli has demonstrated robust tracking of time-varying optima, preventing the collapse of production pathways due to metabolic burden and thereby increasing long-term yield and reducing unit cost [62].
The Scientist's Toolkit: Research Reagent Solutions
Table 4: Essential Reagents and Materials for Implementation
| Item | Function/Application | Example & Notes |
|---|---|---|
| Microfluidic Device | Generates, merges, and sorts picoliter droplets. | Custom-fabricated device with flow-focusing geometry and droplet merger [53]. |
| Biocompatible Surfactant | Stabilizes water-in-oil emulsions for droplet integrity. | PEG-PFPE surfactant in Novec 7500 oil at 2% concentration [53] [64]. |
| Cell-Free System | In vitro transcription-translation chassis for screening. | E. coli lysate-based system (e.g., from BL21 Star strain) [1] [53]. |
| Fluorescent Reporter | Quantifies gene expression output in droplets. | Superfolder GFP (sfGFP) plasmid for CFE; other fluorescent proteins for in vivo [53]. |
| Genetic Circuit Parts | Constructs biosensors and feedback controllers. | Promoters (e.g., inducible, constitutive), RBSs, transcriptional repressors/activators, and degradation tags [62] [63]. |
The predictive engineering of biological systems is fundamentally hampered by context-dependent phenomena, where the behavior and effectiveness of synthetic gene circuits and the proteins they express are heavily influenced by the specific host cell environment [3]. This context dependence results in lengthy design-build-test-learn (DBTL) cycles and limits the deployment of synthetic biological constructs outside laboratory settings [3]. A significant source of this context dependence arises from circuit-host interactions, primarily growth feedback and resource competition [3]. Growth feedback creates a multiscale loop where protein expression burdens the host cell, reducing its growth rate, which in turn alters circuit behavior and protein output [3]. Resource competition occurs when multiple genetic modules compete for a finite pool of shared transcriptional and translational resources, such as RNA polymerase (RNAP) and ribosomes, leading to unintended coupling and repression between modules [3]. These interactions necessitate robust validation strategies that can account for and quantify such emergent dynamics across different platforms and host systems.
Core Concepts: Understanding Key Interactions
Feedback Contextual Factors in Protein Expression
- Growth Feedback: A reciprocal relationship exists between a synthetic circuit and the host cell's growth rate. The cellular burden caused by the circuit's consumption of transcriptional/translational resources slows host growth. This reduced growth rate then changes the circuit's behavior by altering the dilution rate of expressed proteins and the physiological state of the cell [3].
- Resource Competition: Within a single host, multiple synthetic modules compete for limited, shared cellular resources. In bacterial systems, competition for translational resources (ribosomes) is typically the dominant constraint, whereas in mammalian cells, competition for transcriptional resources (RNAP) is more significant [3]. This competition can indirectly repress the expression of one protein when another is highly expressed.
The Impact on Assay Robustness
These interactions directly challenge assay robustness by introducing emergent dynamics. For instance, growth feedback can alter the fundamental qualitative states of a genetic circuit, such as causing the loss or emergence of bistability in a self-activation switch, which directly impacts the reliability and predictability of protein expression levels [3]. Furthermore, the serum matrix effect in complex samples like blood serum—where high-abundance proteins interfere with analyte detection—can lead to a loss of assay sensitivity and an increase in false results, complicating the validation of protein biomarkers [65].
Platform Comparison for Multi-Analyte Protein Validation
To overcome the challenges of context dependence and matrix effects, multi-analyte immunoassays have become the tool of choice for identifying and validating protein biomarkers in complex samples [66] [65]. These platforms offer high-throughput capabilities, require smaller sample volumes, and can evaluate one antigen in the context of many others, which is crucial for understanding system-wide interactions [65].
Table 1: Comparison of Multi-Analyte Immunoassay Platforms for Protein Validation
| Platform Feature | Planar Microarrays | Multiplex Bead Systems | Array-Based SPR Chips |
|---|---|---|---|
| Principle | Immobilization of capture molecules (e.g., antibodies) in a grid pattern on a flat surface [66]. | Capture molecules are bound to color-coded or size-coded microscopic beads in suspension [66]. | Real-time, label-free detection of biomolecular interactions on a functionalized sensor surface [66]. |
| Detection Method | Fluorescence-based scanning [66]. | Fluorescence-based flow cytometry [66]. | Surface Plasmon Resonance (SPR) to measure refractive index changes [66]. |
| Throughput | High (thousands of spots per array) [66]. | High (dozens to hundreds of targets per well) [66]. | Medium to High [66]. |
| Sample Volume | Low [65]. | Low [65]. | Low [65]. |
| Key Strength | High-density parallel analysis [66]. | Flexibility; can mix and match bead sets [66]. | Real-time kinetic data (association/dissociation rates) [66]. |
| Key Challenge | Surface functionalization to ensure homogenous ligand coverage and reduce non-specific binding [66] [65]. | Potential for bead aggregation and spectral overlap [66]. | Nonspecific adsorption from complex samples, requiring specific surface chemistries [66]. |
| Dynamic Range | Broad [65]. | Broad [65]. | Broad [66]. |
Integrated Experimental Protocols
This section provides a detailed methodology for a cross-platform validation workflow, from cell-free screening to in vivo confirmation.
Protocol 1: AI-Driven High-Throughput Screening for CFE Optimization
This protocol utilizes the DropAI platform to optimize a cell-free gene expression (CFE) system for robust protein synthesis, minimizing context-dependent effects present in living cells [2].
- Objective: To rapidly identify a simplified, high-yield CFE formulation by screening massive combinatorial sets of biochemical components.
- Primary Workflow Diagram:
- Materials:
- Research Reagent Solutions:
- E. coli or B. subtilis crude cellular extract [2].
- DNA template for the protein of interest (e.g., sfGFP).
- Candidate energy sources (e.g., phosphoenolpyruvate).
- Transcription-Translation factors (e.g., nucleoside triphosphates, amino acids, coenzyme A, NAD, exogenous tRNAs) [2].
- Fluorescent dyes for FluoreCode system.
- Fluorinated oil with PEG-PFPE and Poloxamer 188 surfactant [2].
- Research Reagent Solutions:
- Methodology:
- Microfluidic Library Construction: Use a microfluidic device to generate a pool of carrier droplets containing the CFE mixture (cell extract, DNA template). Sequentially merge each carrier droplet with four satellite droplets, each containing a unique, randomly sampled set of CFE components (energy sources, additives) [2].
- FluoreCode Encoding: Label each satellite droplet component set with a distinct fluorescent color and intensity. The final merged droplet's composition is identified by its unique 4-digit FluoreCode, read via multi-channel droplet imaging [2].
- In-droplet Incubation: Incubate the emulsion to allow for in-droplet protein expression (e.g., sfGFP).
- Imaging and Data Acquisition: Image the droplets to read the FluoreCodes and measure the output fluorescence (e.g., sfGFP intensity) as a proxy for protein yield.
- In silico Optimization: Use the experimental data (FluoreCode + yield) to train a machine learning model (e.g., regression model) to predict the contribution of each component to the final yield.
- Validation: Test the model-predicted, high-yield CFE formulations in a standard bench-scale reaction to confirm increased protein yield and reduced cost [2].
- Expected Outcomes: A significantly simplified CFE formulation with a 2-4 fold reduction in unit cost and a 1.9-2 fold increase in protein yield, validated across multiple different proteins [2].
Protocol 2: Cross-Platform Immunoassay Validation for Biomarker Robustness
This protocol outlines the steps for validating protein expression or discovery findings using orthogonal multi-analyte immunoassay platforms, addressing robustness against matrix effects.
- Objective: To confirm the presence and concentration of target proteins from complex samples (e.g., serum, cell lysates) across independent assay platforms.
- Materials:
- Research Reagent Solutions:
- Complex protein sample (e.g., serum, cell lysate).
- High-quality, well-characterized capture antibodies (e.g., monoclonal) for target proteins [65].
- Labeled detection antibodies (e.g., fluorescently conjugated).
- Assay-specific buffers (blocking, wash, dilution).
- Planar microarray scanner, bead-based flow cytometer, or SPR instrument.
- Research Reagent Solutions:
- Methodology:
- Sample Preparation: Deplete high-abundance serum proteins (if using serum) to mitigate matrix effects [65]. Pre-dilute samples in an appropriate assay buffer.
- Assay Execution:
- Planar Microarray: Incubate the sample on the antibody-functionalized array surface. Wash away unbound material and detect bound antigen with a labeled secondary antibody using a fluorescence scanner [66] [65].
- Multiplex Bead System: Incubate the sample with the mixture of antibody-conjugated beads. After washing, detect bound antigen using a flow cytometer that identifies the bead code and measures the associated fluorescence [66].
- SPR Array: Flow the sample over the antibody-functionalized sensor chip. Monitor the SPR signal in real-time to quantify binding kinetics and concentration without the need for labels [66].
- Data Analysis: Generate standard curves for each target on each platform. Correlate the quantitative results (e.g., concentrations) obtained from the different platforms. Assess inter-platform precision and agreement.
- Troubleshooting: High inter-platform variance often stems from poor antibody specificity/reproducibility or differences in how each platform handles the serum matrix effect [65]. Re-optimize surface functionalization and blocking conditions to minimize non-specific adsorption [66].
The Scientist's Toolkit: Essential Research Reagent Solutions
Table 2: Key Reagents for Cross-Platform Protein Validation
| Reagent / Material | Function | Key Consideration |
|---|---|---|
| Crude Cellular Extracts | Provides the fundamental enzymatic machinery for transcription and translation in CFE systems [2]. | The choice of chassis (E. coli, B. subtilis, etc.) impacts post-translational modifications and overall protein yield [2]. |
| Well-Characterized Antibodies | Act as capture and detection molecules for specific protein targets in immunoassays [65]. | Antibody quality is the largest source of assay failure; specificity, affinity, and lot-to-lot consistency are critical [65]. |
| Energy Regeneration Systems | Fuels the transcription and translation processes in CFE systems by providing ATP and other nucleoside triphosphates [2]. | A major cost driver; optimization and simplification can dramatically reduce unit cost of protein production [2]. |
| Surface Functionalization Chemistries | Enables the stable and oriented immobilization of biomarkers, ligands, or antibodies to assay platforms (microarrays, SPR chips, beads) [66]. | Essential for achieving a homogenous surface, maximizing binding capacity, and minimizing non-specific adsorption from complex samples [66]. |
| Biocompatible Surfactants | Stabilizes emulsions in droplet-based microfluidic systems, preventing droplet coalescence [2]. | Critical for maintaining the integrity of picoliter reactors during incubation and analysis (e.g., PEG-PFPE, Poloxamer 188) [2]. |
Data Analysis and Workflow Integration
A robust validation workflow integrates data from primary screening and secondary confirmation, accounting for contextual interactions.
- Data Structuring for Analysis: For analysis in tools like Tableau, structure data so that each row represents a single experimental observation (e.g., one protein measurement from one platform under one condition). Key fields (columns) should include:
Protein_Name,Platform,Concentration,Growth_Condition,Host_Strain, andReplicate_ID[67]. This granularity allows for aggregation and comparison across multiple variables. - Analyzing Emergent Dynamics: When analyzing circuit performance, explicitly model and test for the effects of growth feedback and resource competition. This can involve measuring host growth rates in parallel with protein output and using mathematical frameworks that dynamically consider host and resource contributions to the system [3].
- Integrated Validation Workflow Diagram:
Achieving robust, cross-platform validation for diverse protein expression requires a strategic shift from considering circuits and proteins in isolation to a host-aware and resource-aware perspective. By integrating high-throughput, AI-driven screening platforms like DropAI with orthogonal, multi-analyte immunoassays, researchers can effectively navigate the challenges of context dependence, growth feedback, and resource competition. The protocols and frameworks detailed in this application note provide a concrete path toward de-risking the biomarker validation pipeline and developing more predictable and deployable synthetic biology solutions.
Synthetic gene circuits represent a transformative approach in modern therapeutics, moving beyond conventional gene replacement strategies by enabling precise, dynamic, and intelligent control of therapeutic functions within the human body. These engineered genetic systems are designed to sense internal disease signals, process this information, and respond with tailored therapeutic actions in real-time [68] [69]. While laboratory research has demonstrated increasingly sophisticated circuit designs, their translation into clinical applications presents distinct challenges and opportunities that are now being addressed through innovative engineering approaches and advanced screening technologies.
The clinical translation of synthetic gene circuits reveals a notable paradox: although preclinical studies show remarkable sophistication, current clinical applications predominantly utilize relatively simple, inducible systems [68]. This gap highlights both the immense potential and significant hurdles in bringing advanced synthetic biology technologies into routine medical practice. This article examines the current landscape through key therapeutic case studies, details the experimental protocols enabling their development, and explores how high-throughput microfluidic screening platforms are accelerating their path to the clinic.
Clinical Case Studies of Synthetic Gene Circuits
Safety-Enhanced CAR-T Cell Circuits for Cancer Immunotherapy
Chimeric Antigen Receptor (CAR)-T cell therapy has demonstrated remarkable success against hematological malignancies, but its application is limited by significant safety concerns, including on-target, off-tumor toxicity and cytokine release syndrome [68]. Synthetic gene circuits have been engineered to mitigate these risks through precise control over T-cell activity.
Suicide Safety Switches: The most clinically advanced safety circuits are "suicide switches" that enable selective elimination of CAR-T cells upon occurrence of adverse events. The inducible caspase 9 (iCasp9) system has shown clinical validation; administration of the small-molecule dimerizer AP1903 triggers caspase-mediated apoptosis of engineered T cells [68]. Clinical trials have demonstrated that iCasp9 can effectively control graft-versus-host disease in alloreplete T cells after haploidentical stem cell transplantation [68].
Logic-Gated CAR-T Circuits: To enhance tumor specificity, researchers have developed logic-gated circuits that require multiple antigen signatures to activate T cells. The Tmod cellular logic gate is a prominent example designed to distinguish tumor from healthy cells by exploiting genetic loss-of-heterozygosity common in cancer cells [68]. Another system, the logic-gated ROR1 chimeric antigen receptor, utilizes a Boolean AND gate requiring two tumor-associated antigens for full T-cell activation, thereby improving tumor selectivity [68].
Protease-Regulated CAR-T Circuits: Recent advances include circuits that are activated by tumor-specific proteases. These systems incorporate a protease-sensitive linker that shields the CAR domain until cleaved by tumor-associated proteases such as those in the tumor microenvironment [68]. This design has demonstrated enhanced safety profiles by limiting CAR activity to protease-rich tumor environments.
Table 1: Clinically-Advanced Safety Circuits in CAR-T Therapy
| Circuit Name | Circuit Type | Activation/Deactivation Mechanism | Therapeutic Application | Clinical Status |
|---|---|---|---|---|
| iCasp9 | Suicide Switch | Small-molecule (AP1903) induced caspase-9 dimerization | Control of GvHD; manage CAR-T toxicity | Validated in clinical trials [68] |
| Tmod System | Logic Gate | Distinguishes cells based on loss-of-heterozygosity | Solid tumor targeting | Preclinical development [68] |
| Protease-Regulated CAR | Microenvironment Sensor | Tumor-specific protease cleavage of protective shield | Solid tumor targeting | Preclinical development [68] |
Precision Gene Dosage Control for Monogenic Disorders
Monogenic disorders often require precise gene expression levels for therapeutic efficacy—too little expression provides insufficient benefit, while too much can cause toxicity. The ComMAND gene circuit (Compact MicroRNA-based Auto-regulatory Non-coding Design) developed by MIT engineers addresses this critical challenge [70].
This system utilizes an incoherent feedforward loop (IFFL) topology incorporated into a single transcript, enabling precise control over transgenic cargo dosage. The circuit employs microRNA-mediated repression to maintain expression within a therapeutic window. When tested with the FXN gene (mutated in Friedreich's ataxia) and the Fmr1 gene (causative in fragile X syndrome), the ComMAND circuit achieved expression levels of approximately 8 times normal levels—significantly more controlled than the >50-fold overexpression observed with conventional gene delivery [70]. This compact, single-promoter design enhances compatibility with common viral delivery vectors such as lentivirus and adeno-associated virus (AAV), facilitating clinical translation.
Self-Regulating Circuits for Metabolic Disorders
Metabolic disorders such as diabetes involve complex, dynamic physiological fluctuations that require continuous monitoring and adjustment. Synthetic gene circuits offer a promising approach for closed-loop therapy that autonomously regulates metabolic homeostasis.
Glucose-Regulating Circuits: Researchers have developed circuits that sense blood glucose levels and respond with appropriate insulin expression. These typically utilize glucose-responsive promoters or synthetic transcription factors that activate insulin expression in response to hyperglycemia [68]. Such systems aim to mimic the function of healthy pancreatic β-cells by providing dynamic, dose-responsive insulin production without requiring patient intervention.
Circuit-Enabled Biodevices: Beyond cellular therapies, synthetic circuits can be incorporated into implantable biodevices containing engineered cells. These devices can continuously monitor metabolic parameters and secrete therapeutic proteins on-demand, creating a self-regulating therapeutic system [69]. This approach has potential application for various hormonal disorders and metabolic conditions including obesity, dyslipidemia, and hypertension [68].
High-Throughput Screening Platforms for Circuit Development
The development and optimization of synthetic gene circuits requires extensive characterization of genetic components and their interactions. Traditional methods are often slow, costly, and low-throughput. Recent advances in microfluidics and AI-driven screening are revolutionizing this process.
The Cell-Free Processing Unit (CFPU) for Steady-State Analysis
The Cell-Free Processing Unit (CFPU) is an automated microfluidic platform that enables high-throughput screening of gene circuits under steady-state conditions [1]. This system addresses a critical limitation of conventional screening by allowing researchers to study circuit behavior in a controlled, continuous-flow environment that mimics physiological conditions more accurately than batch reactions.
Key Features:
- 280 individual chemostats that can be programmed with different DNA circuits
- Continuous supply of transcription-translation (tx-tl) reagents maintaining sustained steady-state conditions
- Microfluidic pulse width modulation (PWM) for real-time control of reagent composition
- Significantly higher throughput and lower reagent consumption compared to traditional chemostats [1]
Applications: The CFPU has been used to map transcription factor-based repression under equilibrium conditions and implement dynamic gene circuits switchable by small molecules, providing invaluable data for circuit optimization prior to cellular implementation [1].
DropAI: AI-Driven Droplet Screening
The DropAI platform combines microfluidics with machine learning to optimize cell-free gene expression (CFE) systems—a key technology for prototyping genetic circuits [2]. This approach addresses the formidable challenge of screening the complex, multi-component mixtures required for CFE systems, which typically contain approximately 40 additional components beyond the crude cell extract [2].
Workflow:
- Microfluidic Construction: Generation of picoliter-sized droplets (∼250 pL) serving as discrete bioreactors
- Fluorescent Color-Coding: Each droplet is labeled with a unique FluoreCode that identifies its specific chemical composition
- High-Throughput Imaging: Parallel reading of fluorescence codes and protein expression outputs
- Machine Learning Optimization: Experimental data trains models to predict high-yield combinations beyond the experimentally tested space [2]
Performance: The platform can create combinations at approximately 1,000,000 per hour, consuming only ∼12.5 μL of reagents for a screening pool of 50,000 droplets [2]. When applied to optimize an E. coli-based CFE system, DropAI achieved a 2.1-fold decrease in unit cost and a 1.9-fold increase in yield of expressed superfolder green fluorescent protein (sfGFP) [2].
Experimental Protocols
Protocol: Characterizing Gene Circuits Using the CFPU Platform
This protocol details the procedure for screening and characterizing synthetic gene circuits under steady-state conditions using the Cell-Free Processing Unit (CFPU) [1].
Materials Required:
- CFPU microfluidic device
- DNA templates for circuit variants
- Transcription-translation (tx-tl) reagents (cell extract, energy sources, amino acids, nucleotides)
- Fluorescent reporters (e.g., sfGFP, mCherry)
- Syringe pumps and tubing
- Fluorescence microscopy setup
Procedure:
- Device Priming: Flush the CFPU microfluidic channels with fluorinated oil to establish stable droplet generation.
- DNA Circuit Loading: Individually load the 280 chemostats with different DNA circuit variants (∼100 nL each) using the automated addressing system.
- Reagent Formulation: Prepare the tx-tl master mix according to standard cell-free expression protocols, including fluorescent reporter genes appropriate for your circuit outputs.
- Droplet Generation and Merging: Initiate the formation of carrier droplets containing the tx-tl mix and satellite droplets containing circuit-specific components. Use the micro-teeth structures to merge one carrier with three satellite droplets to form complete screening units.
- Continuous-Flow Incubation: Maintain continuous flow of tx-tl reagents through the system to establish steady-state conditions. Flow rates typically range from 50-200 μL/hour depending on desired residence time.
- Real-Time Monitoring: Image droplets every 15-30 minutes using multi-channel fluorescence microscopy to monitor circuit dynamics and output signals.
- Data Extraction: Process fluorescence images to quantify circuit performance over time under steady-state conditions.
- Circuit Analysis: Calculate key parameters including activation kinetics, steady-state output levels, and response functions for different input conditions.
Troubleshooting Tips:
- If droplet stability is compromised, add Poloxamer 188 (0.1-0.5% w/v) and PEG-6000 (1-2% w/v) to the aqueous phase to improve emulsion stability [2].
- For poor fluorescence signals, optimize DNA concentration (typically 5-20 nM) and ensure adequate energy regeneration components are present.
- If chemostats show inconsistent behavior, verify that the PWM system is properly calibrated for consistent reagent delivery.
Protocol: Implementing the ComMAND Circuit for Precise Gene Expression
This protocol describes the implementation of the ComMAND incoherent feedforward loop circuit for controlling therapeutic gene dosage in human cells [70].
Materials Required:
- ComMAND circuit plasmid (therapeutic gene + microRNA target sites)
- Appropriate microRNA expression plasmid or endogenous microRNA
- Lentiviral or AAV packaging system
- Target cells (e.g., HEK293T, primary fibroblasts, neurons)
- Transfection reagents
- Flow cytometry equipment for GFP quantification
- qRT-PCR reagents for microRNA and mRNA quantification
Procedure:
- Circuit Design: Clone your therapeutic gene of interest into the ComMAND backbone, ensuring the microRNA target sites are incorporated in the 3'UTR. Select microRNAs based on their expression profile in your target cell type.
- Vector Packaging: Package the circuit into lentiviral or AAV vectors using standard packaging protocols. Purify and concentrate viral particles to appropriate titers (typically 10^8-10^9 IU/mL for in vitro work).
- Cell Transduction/Transfection: Transduce target cells with the viral vector at varying MOIs (0.1-10) to achieve different copy numbers. Include controls with conventional expression vectors (without regulatory circuit).
- Expression Analysis: 48-72 hours post-transduction:
- Harvest cells and analyze protein expression using flow cytometry (for fluorescent reporters) or Western blot (for non-fluorescent proteins).
- Extract RNA and quantify transcript levels using qRT-PCR to assess mRNA expression.
- Measure microRNA levels to verify regulatory element activity.
- Dose-Response Characterization: Measure expression levels across a range of vector doses to establish the dynamic range and determine the therapeutic window.
- Functional Validation: In disease models, assess whether the controlled expression rescues phenotype without toxicity.
Expected Results: The ComMAND circuit should maintain expression within a narrow range (approximately 8-fold normal levels) despite varying vector doses, compared to conventional vectors that may show >50-fold variation [70].
Table 2: Key Research Reagent Solutions for Synthetic Gene Circuit Development
| Reagent/Category | Specific Examples | Function/Application | Considerations for Use |
|---|---|---|---|
| Circuit Delivery Vectors | Lentivirus, AAV, plasmids | Introduce genetic circuits into target cells | AAV has better safety profile; lentivirus for larger circuits; consider payload capacity [70] |
| Cell-Free Expression Systems | E. coli extract, B. subtilis extract, wheat germ extract | Rapid circuit prototyping without cells | Different extracts have varying efficiencies; optimize for specific circuit types [1] [2] |
| Microfluidic Devices | CFPU, DropAI platforms, droplet generators | High-throughput circuit characterization | Enables massive parallel screening; requires specialized equipment and expertise [1] [2] |
| Regulatory Components | microRNAs, transcription factors, recombinases | Implement control logic in circuits | Ensure orthogonality to host systems; consider context-dependence [71] [70] |
| Reporters and Biosensors | Fluorescent proteins, luciferase, enzymatic reporters | Quantify circuit performance and outputs | Choose based on sensitivity, dynamic range, and compatibility with screening platform [1] [2] |
Synthetic gene circuits are poised to revolutionize therapeutic development by providing unprecedented control over therapeutic interventions. The case studies presented herein demonstrate tangible progress toward clinical implementation, particularly in the areas of cancer immunotherapy, monogenic disorders, and metabolic diseases. The ongoing development of sophisticated safety switches, logic gates, and autonomous regulators represents a paradigm shift from static to dynamic therapeutics.
Critical to this clinical translation are the advanced screening platforms that enable rapid characterization and optimization of circuit performance. Microfluidic systems like the CFPU and DropAI are dramatically accelerating the design-build-test-learn cycle, while AI and machine learning approaches are enhancing our ability to predict circuit behavior in complex biological environments [1] [2]. As these technologies mature and converge, they will undoubtedly overcome current limitations in circuit complexity, predictability, and manufacturability.
The future path to the clinic will be paved by continued interdisciplinary collaboration between synthetic biologists, clinical researchers, and engineers. By leveraging these advanced tools and learning from early clinical experiences, the next generation of synthetic gene circuits will fulfill their potential as intelligent, autonomous therapeutics capable of dynamically managing complex diseases with precision and safety.
Conclusion
The integration of microfluidic high-throughput screening with synthetic biology represents a paradigm shift, moving genetic circuit design from a slow, iterative process to a rapid, data-rich engineering discipline. By leveraging picoliter droplets, researchers can now screen vast libraries with unprecedented speed and minimal reagent consumption, while AI and machine learning transform this data into predictive models for circuit optimization. This synergy not only simplifies complex biological systems and reduces development costs but also directly enables the creation of more sophisticated and safer therapeutic interventions, such as smart CAR-T cells and metabolically responsive circuits. The future of the field lies in the continued convergence of biology, engineering, and computer science—developing more robust and automated screening platforms, expanding the repertoire of biosensors, and refining AI algorithms to usher in a new era of intelligent, clinically viable genetic medicines.
References
- 1. CFPU: A Cell-Free Processing Unit for High-Throughput ... [https://www.sciencedirect.com/science/article/pii/S2693125724000591]
- 2. AI-driven high-throughput droplet screening of cell-free ... [https://www.nature.com/articles/s41467-025-58139-0]
- 3. Context-Dependent Redesign of Robust Synthetic Gene ... [https://pmc.ncbi.nlm.nih.gov/articles/PMC11223972/]
- 4. Emerging Trends in Microfluidics [https://elveflow.com/microfluidic-reviews/emerging-trends-in-microfluidics/]
- 5. Synthetic gene circuit evolution: Insights and opportunities at ... [https://pmc.ncbi.nlm.nih.gov/articles/PMC11330362/]
- 6. 3 Ways High-Throughput Assay Development Accelerates ... [https://dispendix.com/blog/3-ways-high-throughput-assay-development-accelerates-discovery]
- 7. Integrating synthetic biology and biosensing [https://www.sciencedirect.com/science/article/abs/pii/S305047592500778X]
- 8. Advancements and Future Perspectives of Microfluidic ... [https://pmc.ncbi.nlm.nih.gov/articles/PMC12442622/]
- 9. Droplet Microfluidics for Advanced Single-Cell Analysis [https://pubmed.ncbi.nlm.nih.gov/40303868/]
- 10. Droplet Microfluidics for Advanced Single‐Cell Analysis - PMC [https://pmc.ncbi.nlm.nih.gov/articles/PMC11970111/]
- 11. Innovative Advances in Droplet Microfluidics - PMC [https://pmc.ncbi.nlm.nih.gov/articles/PMC12384975/]
- 12. A data driven framework for optimizing droplet microfluidics ... [https://www.nature.com/articles/s41598-025-14730-5]
- 13. High Throughput Screening Market [https://www.futuremarketinsights.com/reports/high-throughput-screening-market]
- 14. High-Throughput Screening Market Size, Share & Forecast ... [https://www.researchnester.com/reports/high-throughput-screening-hts-market/3521]
- 15. Optimized pipeline and designer cells for synthetic-biology- ... [https://pmc.ncbi.nlm.nih.gov/articles/PMC12461586/]
- 16. Engineering wetware and software for the predictive ... [https://www.nature.com/articles/s41467-025-64457-0]
- 17. Molecular Spies in Action: Genetically Encoded Fluorescent ... [https://pmc.ncbi.nlm.nih.gov/articles/PMC11613326/]
- 18. Genetically encoded biosensor for fluorescence ... | Nature Methods [https://www.nature.com/articles/s41592-025-02610-9?error=cookies_not_supported&code=080f07bc-3f11-49dd-a764-90a479a1e7e0]
- 19. microfluidic droplet and emulsion science [https://elveflow.com/microfluidic-reviews/digital-microfluidics-microfluidic-droplet-emulsion-science/]
- 20. On-demand droplet formation at a T-junction: modelling ... [https://www.nature.com/articles/s41378-025-00950-2]
- 21. Microfluidic Flow focusing droplet generation [https://elveflow.com/microfluidic-applications/microfluidic-flow-focusing-droplet-generation/]
- 22. CFD study and Experimental Verification of droplet ... [https://www.sciencedirect.com/science/article/pii/S2665906925000170]
- 23. A numerical study on the dynamics of droplet formation in ... [https://pmc.ncbi.nlm.nih.gov/articles/PMC4376751/]
- 24. 10 Tips for Reliable Microfluidic Droplet Generation [https://www.fluigent.com/resources-support/expertise/expertise-reviews/droplet-and-particle-generation-in-microfluidics/10-tips-reliable-droplet-generation/]
- 25. High-throughput screening by droplet microfluidics [https://pmc.ncbi.nlm.nih.gov/articles/PMC12183681/]
- 26. Genetically-encoded sensors to detect fatty acid production ... [https://www.sciencedirect.com/science/article/pii/S2212877819306556]
- 27. Droplet-based functional CRISPR screening of cell–cell ... [https://pmc.ncbi.nlm.nih.gov/articles/PMC11805652/]
- 28. A high-throughput synthetic biology approach for studying ... [https://pubmed.ncbi.nlm.nih.gov/38906116/]
- 29. High-throughput injection with microfluidics using picoinjectors - PMC [https://www.ncbi.nlm.nih.gov/pmc/articles/PMC2984161/]
- 30. Picoinjection — Abate Lab at UCSF [https://www.abatelab.org/picoinjection]
- 31. Droplet-Based Microfluidics : An Intuitive Design Guideline [https://eden-microfluidics.com/news-events/droplet-based-microfluidics-a-design-guideline/]
- 32. for Single Cell Directed... Fluorescence Activated Droplet Sorting [https://pmc.ncbi.nlm.nih.gov/articles/PMC6942126/]
- 33. High-throughput multiplexed fluorescence-activated droplet ... [https://pmc.ncbi.nlm.nih.gov/articles/PMC6220162/]
- 34. iSort enables automated complex microfluidic droplet ... [https://www.sciencedirect.com/science/article/pii/S2667237523001017]
- 35. Synthetic Biology Goes Cell - Free | BMC Biology | Full Text [https://bmcbiol.biomedcentral.com/articles/10.1186/s12915-019-0685-x]
- 36. A rapid cell-free expression and screening platform for ... [https://www.nature.com/articles/s41467-023-38965-w]
- 37. Revisiting lab-on-a-chip technology for drug discovery - PMC [https://pmc.ncbi.nlm.nih.gov/articles/PMC6493334/]
- 38. High content screening in microfluidic devices - PMC [https://pmc.ncbi.nlm.nih.gov/articles/PMC3156449/]
- 39. Microfluidics for High Throughput Screening of Biological ... [https://link.springer.com/article/10.1007/s44174-024-00169-1]
- 40. Advanced droplet microfluidic platform for high-throughput ... [https://www.sciencedirect.com/science/article/pii/S0956566325004683]
- 41. High-Throughput Screening [https://atrandi.com/application/high-throughput-screening]
- 42. Robust Microfabrication of Highly Parallelized Three- ... [https://www.nature.com/articles/s41598-019-48515-4]
- 43. Biosensors, Artificial Intelligence Biosensors, False Results ... [https://pmc.ncbi.nlm.nih.gov/articles/PMC12025796/]
- 44. Biosensors—Publication Trends and Knowledge Domain ... [https://pmc.ncbi.nlm.nih.gov/articles/PMC6603684/]
- 45. Challenges and Opportunities in Smart Biosensing for ... [https://pmc.ncbi.nlm.nih.gov/articles/PMC12455640/]
- 46. Effective use of biosensors for high-throughput library ... [https://pmc.ncbi.nlm.nih.gov/articles/PMC8788864/]
- 47. Biosensor-based dual-color droplet microfluidic platform for ... [https://www.sciencedirect.com/science/article/abs/pii/S0956566325002507]
- 48. AI-powered high-throughput digital colony picker platform ... [https://www.nature.com/articles/s41467-025-63929-7]
- 49. Toward predictive engineering of gene circuits - PMC [https://pmc.ncbi.nlm.nih.gov/articles/PMC12519959/]
- 50. High-Throughput Screening Meets AI and 3D Models [https://www.technologynetworks.com/drug-discovery/articles/how-high-throughput-screening-is-transforming-modern-drug-discovery-405922]
- 51. High Throughput Screening (HTS) Market Size 2025-2029 [https://www.technavio.com/report/high-throughput-screening-market-industry-analysis]
- 52. Drivers of Change in High-throughput Screening ... [https://www.datainsightsmarket.com/reports/high-throughput-screening-technology-1471015]
- 53. AI-driven high-throughput droplet screening of cell-free gene ... [https://pmc.ncbi.nlm.nih.gov/articles/PMC11923291/]
- 54. Engineering genetic circuit interactions within and between ... [https://pmc.ncbi.nlm.nih.gov/articles/PMC5407321/]
- 55. A Simple Statistical Parameter for Use in Evaluation and ... [https://www.sciencedirect.com/science/article/pii/S2472555222086403]
- 56. Hit-to-Lead: Hit Validation and Assessment [https://pubmed.ncbi.nlm.nih.gov/30390802/]
- 57. A pragmatic approach to hit validation following ... [https://www.drugtargetreview.com/article/27913/hit-validation-high-throughput-screening/]
- 58. High Throughput Screening Assays for Drug Discovery [https://bellbrooklabs.com/high-throughput-screening-assays-drug-discovery/?srsltid=AfmBOooR2oHzEhNZ3vMUfI8v9_QAfRLetNcywLeQ24jVrSrOxUawAP6e]
- 59. Microfluidics for cell-based high throughput screening ... [https://www.sciencedirect.com/science/article/abs/pii/S0003267015013823]
- 60. State-of-the-art in high throughput organ-on-chip for ... [https://pmc.ncbi.nlm.nih.gov/articles/PMC12149869/]
- 61. High Throughput Screening Market Forecast, 2025-2032 [https://www.coherentmarketinsights.com/industry-reports/high-throughput-screening-market]
- 62. A blueprint for a synthetic genetic feedback optimizer [https://www.nature.com/articles/s41467-023-37903-0]
- 63. Review Genetic circuits for metabolic flux optimization [https://www.sciencedirect.com/science/article/pii/S0966842X24000040]
- 64. High-throughput droplet microfluidics screening and genome ... [https://biotechnologyforbiofuels.biomedcentral.com/articles/10.1186/s13068-023-02437-6]
- 65. Validation Processes of Protein Biomarkers in Serum—A Cross Platform Comparison - PMC [https://www.ncbi.nlm.nih.gov/pmc/articles/PMC3478866/]
- 66. Validation processes of protein biomarkers in serum--a cross platform comparison - PubMed [https://pubmed.ncbi.nlm.nih.gov/23112739/]
- 67. Structure Data for Analysis [https://help.tableau.com/current/pro/desktop/en-us/data_structure_for_analysis.htm]
- 68. Translating synthetic gene circuits into the clinic [https://www.sciencedirect.com/science/article/abs/pii/S2405471225002583]
- 69. Therapeutic applications of synthetic gene/genetic circuits - PMC [https://pmc.ncbi.nlm.nih.gov/articles/PMC11330796/]
- 70. MIT Engineers Develop Gene Circuit for Precise Control of ... [https://www.avancebio.com/mit-engineers-develop-gene-circuit-for-precise-control-of-gene-therapy/]
- 71. Genetic circuits in synthetic biology: broadening ... [https://www.frontiersin.org/journals/synthetic-biology/articles/10.3389/fsybi.2025.1548572/full]