Automating Discovery: How Robotic Platforms and AI Are Revolutionizing the Design-Build-Test-Learn Cycle in Drug Development
This article explores the transformative integration of robotic platforms and artificial intelligence in automating the Design-Build-Test-Learn (DBTL) cycle for biomedical research and drug development.
Automating Discovery: How Robotic Platforms and AI Are Revolutionizing the Design-Build-Test-Learn Cycle in Drug Development
Abstract
This article explores the transformative integration of robotic platforms and artificial intelligence in automating the Design-Build-Test-Learn (DBTL) cycle for biomedical research and drug development. Aimed at researchers, scientists, and drug development professionals, it provides a comprehensive examination of the foundational principles, methodological applications, and optimization strategies that are reshaping laboratory workflows. The content covers the urgent industry need for these technologies in overcoming low clinical success rates, details the specific robotic and AI tools enabling high-throughput experimentation, and offers a comparative analysis of their validation and economic impact. By synthesizing current trends and real-world applications, this guide serves as a strategic resource for labs aiming to enhance efficiency, accelerate discovery, and improve the success rates of new therapeutic candidates.
The Urgent Drive for Automation: Reversing Stagnant Success Rates in Drug Development
The biopharmaceutical industry is experiencing a significant productivity paradox: despite unprecedented levels of research activity and investment, clinical success rates are declining while costs escalate. With over 23,000 drug candidates in development and more than $300 billion spent annually on R&D, the industry faces immense pressure as R&D margins are projected to decline from 29% to 21% of total revenue by 2030 [1].
Table 1: Key Indicators of the R&D Productivity Challenge
| Metric | Current Status | Trend | Impact |
|---|---|---|---|
| Phase 1 Success Rate | 6.7% (2024) | Down from 10% a decade ago | Higher attrition in early development [1] |
| R&D Spending | >$300 billion annually | Increasing | Record investment levels [1] |
| R&D Margin | 29% of revenue | Projected to fall to 21% by 2030 | Decreasing efficiency [1] |
| Internal Rate of Return | 4.1% | Below cost of capital | Unsustainable investment model [1] |
| Revenue at Risk | $350 billion (2025-2029) | Patent cliff | Pressure on innovation funding [1] |
Compounding these challenges, clinical trial complexity and costs continue to rise due to factors including uncertain regulatory environments, geopolitical conflicts, and increased data intensity [2]. This application note details how automated Design-Build-Test-Learn (DBTL) platforms can address this productivity paradox through integrated artificial intelligence and robotics.
Experimental Protocols: Automated DBTL Platform Implementation
Platform Architecture and Workflow Integration
We describe a generalized platform for autonomous enzyme engineering that exemplifies the DBTL cycle application. The platform integrates machine learning, large language models, and biofoundry automation to eliminate human intervention bottlenecks while improving outcomes [3].
Diagram 1: Automated DBTL Cycle - Core iterative process for autonomous enzyme engineering.
Detailed Protocol: Automated Protein Engineering Workflow
Module 1: AI-Driven Protein Variant Design
- Input Requirements: Wild-type protein sequence and quantifiable fitness function [3]
- Design Method: Combine ESM-2 protein large language model with EVmutation epistasis model [3]
- Library Specifications: Generate 180 initial variants targeting diverse mutation spaces
- Success Metrics: 55-60% of variants performing above wild-type baseline [3]
Module 2: Automated Construction Pipeline
- Method: HiFi-assembly based mutagenesis eliminating intermediate sequencing verification [3]
- Accuracy: ~95% correct targeted mutations confirmed via random sequencing [3]
- Automation: Seven integrated modules programmed on iBioFAB platform
- Key Steps:
- Mutagenesis PCR preparation
- DpnI digestion
- 96-well microbial transformations
- Automated colony picking
- Plasmid purification
- Protein expression
- Functional enzyme assays [3]
Table 2: Automated DBTL Platform Performance Metrics
| Performance Indicator | AtHMT Engineering | YmPhytase Engineering | Timeframe |
|---|---|---|---|
| Activity Improvement | 16-fold (ethyltransferase) | 26-fold (neutral pH) | 4 weeks [3] |
| Substrate Preference | 90-fold improvement | N/A | 4 weeks [3] |
| Variants Constructed | <500 | <500 | 4 rounds [3] |
| Library Efficiency | 59.6% above wild-type | 55% above wild-type | Initial round [3] |
Diagram 2: Automated Experimental Workflow - Integrated modules for continuous protein engineering.
Protocol Validation: Case Studies in Enzyme Engineering
Case Study 1: Arabidopsis thaliana Halide Methyltransferase (AtHMT)
- Engineering Goal: Improve ethyltransferase activity and substrate preference [3]
- Fitness Function: Preference for ethyl iodide over methyl iodide
- Results: 90-fold improvement in substrate preference, 16-fold improvement in ethyltransferase activity [3]
- Screening Throughput: <500 variants constructed and characterized over 4 rounds [3]
Case Study 2: Yersinia mollaretii Phytase (YmPhytase)
- Engineering Goal: Enhance activity at neutral pH for animal feed applications [3]
- Fitness Function: Activity at neutral pH versus acidic optimum
- Results: 26-fold improvement in activity at neutral pH [3]
- Industrial Application: Improved gastrointestinal tract functionality [3]
The Scientist's Toolkit: Research Reagent Solutions
Table 3: Essential Research Reagents for Automated DBTL Platforms
| Reagent / Material | Function | Application Notes |
|---|---|---|
| HiFi Assembly Mix | DNA assembly with high fidelity | Enables mutagenesis without intermediate sequencing [3] |
| ESM-2 Protein LLM | Variant fitness prediction | Unsupervised model trained on global protein sequences [3] |
| EVmutation Model | Epistasis analysis | Focuses on local homologs of target protein [3] |
| Low-N Machine Learning Model | Fitness prediction from sparse data | Trained on each cycle's assay data for subsequent iterations [3] |
| Automated Liquid Handling | High-throughput reagent distribution | Integrated with central robotic arm scheduling [3] |
| 96-well Microbial Culture Plates | Parallel protein expression | Compatible with automated colony picking [3] |
| Functional Assay Reagents | High-throughput activity screening | Quantifiable measurements compatible with automation [3] |
Discussion: Addressing the Productivity Paradox
The automated DBTL platform demonstrates a viable path to addressing the R&D productivity crisis. By completing four engineering rounds in four weeks with fewer than 500 variants per enzyme, the platform achieves order-of-magnitude improvements while significantly reducing resource requirements [3]. This approach directly counteracts the trends of rising costs and declining success rates documented in clinical development [1].
The integration of AI and automation enables more efficient navigation of vast biological search spaces while reducing human-intensive laboratory work. This is particularly valuable in the context of rising trial costs driven by complexity, regulatory uncertainty, and geopolitical factors [2]. As the industry faces the largest patent cliff in history, with $350 billion of revenue at risk between 2025-2029 [1], such platforms offer a strategic approach to maintaining innovation capacity despite margin pressures.
Future developments should focus on expanding these platforms to more complex biological systems, including mammalian cell engineering and clinical trial optimization, where the productivity challenges are most acute. The generalized nature of the described platform provides a framework for such extensions, potentially transforming R&D productivity across the biopharmaceutical industry.
The development of new therapeutic compounds often overshadows a critical and frequently underestimated challenge: the formulation bottleneck. This pivotal stage in the drug development pipeline represents a significant failure point where promising active pharmaceutical ingredients (APIs) stumble due to inadequate delivery systems. Effective drug delivery is paramount for ensuring optimal bioavailability, therapeutic efficacy, and patient compliance. Within modern biopharmaceutical research, the integration of robotic platforms and automated Design-Build-Test-Learn (DBTL) cycles is emerging as a transformative approach to systematically address these formulation challenges. These automated systems enable rapid, data-driven optimization of delivery parameters, accelerating the development of robust formulations for increasingly complex modalities, including biologics, cell therapies, and nucleic acids [4] [5]. This Application Note provides a detailed framework, complete with quantitative data and standardized protocols, for leveraging automation to overcome the critical drug delivery bottleneck.
Quantitative Analysis of the Formulation Landscape
The growing importance of advanced drug delivery systems is reflected in market data and pipeline valuations. The following tables summarize key quantitative insights into the current landscape and the specific challenges posed by different drug modalities.
Table 1: Global Market Analysis for New Drug Delivery Systems (2025-2029)
| Metric | Value | Source/Note |
|---|---|---|
| Market Size (2025) | USD 59.4 Billion (Projected) | Technavio, 2025 [6] |
| Forecast Period CAGR | 4.6% | Technavio, 2025 [6] |
| North America Market Share | 36% (Largest Share) | Technavio, 2025 [6] |
| Oncology Segment Value (2023) | USD 74.70 Billion | Technavio, 2025 [6] |
Table 2: New Modalities in the Pharma Pipeline (2025 Analysis)
| Drug Modality | Pipeline Value & Growth Trends | Key Formulation & Delivery Challenges |
|---|---|---|
| Antibodies (mAbs, ADCs, BsAbs) | \$197B total pipeline value; Robust growth (e.g., ADCs up 40% YoY) [4] | High viscosity, volume for subcutaneous delivery; stability [4] [7] |
| Proteins & Peptides (e.g., GLP-1s) | 18% revenue growth driven by GLP-1 agonists [4] | High concentration formulations; device compatibility [4] |
| Cell Therapies (CAR-T, TCR-T) | Rapid pipeline growth, but high costs and mixed results in solid tumors [4] | Complex logistics (cold chain); in vivo manufacturing hurdles [4] |
| Gene Therapies | Stagnating growth; safety issues and commercial hurdles [4] | Vector efficiency; targeted delivery; immunogenicity [4] |
| Nucleic Acids (RNAi, ASO) | Rapid growth (e.g., RNAi pipeline value up 27% YoY) [4] | Targeted tissue delivery; endosomal escape; stability [4] |
Automated DBTL Protocols for Formulation Optimization
The Design-Build-Test-Learn (DBTL) cycle, when implemented on a robotic platform, creates a closed-loop, autonomous system for overcoming formulation bottlenecks. The following protocols detail the experimental workflow for optimizing a critical formulation parameter: the induction profile for a recombinant protein-based API.
Protocol: Automated Optimization of Induction Parameters for Recombinant API Expression
1. Objective: To autonomously determine the optimal inducer concentration and feed rate that maximizes the yield of a model recombinant API (e.g., Green Fluorescent Protein, GFP) in an E. coli system using a robotic DBTL platform.
2. Research Reagent Solutions: Table 3: Essential Materials for Automated Induction Optimization
| Research Reagent | Function in Protocol |
|---|---|
| E. coli Expression Strain | Recombinant host containing plasmid with API gene under inducible promoter. |
| Lysogeny Broth (LB) Media | Standard growth medium for bacterial cultivation. |
| Chemical Inducer (e.g., IPTG) | Triggers transcription of the target API gene. |
| Carbon Source Feed (e.g., Glucose) | Fed-batch substrate to maintain cell viability and productivity. |
| Robotic Bioprocessing Platform | Integrated system for liquid handling, incubation, and monitoring [5]. |
| Microplate Reader (on-platform) | Measures optical density (OD600) and fluorescence (GFP) in real-time. |
3. Methodology:
3.1. Design Phase: The software framework defines the experimental search space, typically a range of inducer concentrations (e.g., 0.1 - 1.0 mM IPTG) and feed rates (e.g., 0.5 - 5.0 mL/h). An optimization algorithm (e.g., Bayesian Optimization) is initialized to balance exploration of the parameter space and exploitation of known high-yield regions [5].
3.2. Build & Test Phase:
- The robotic platform automatically prepares a set of culture conditions in a deep-well microplate according to the parameters selected by the algorithm.
- The plate is transferred to an on-platform incubator-shaker, maintaining optimal temperature and agitation.
- The platform executes periodic sampling, using integrated liquid handlers to transfer aliquots to a reading plate.
- The microplate reader measures OD600 (biomass) and fluorescence/absorbance (API yield) for each well [5].
- All data is automatically written to a centralized database with full provenance.
3.3. Learn Phase:
- An optimizer software component analyzes the collected time-resolved data, calculating a fitness function (e.g., volumetric yield of API/GFP).
- The learning algorithm processes the results and selects the next set of inducer and feed rate parameters to test, effectively "closing the loop" [5].
- The cycle iterates autonomously until a convergence criterion is met (e.g., yield improvement < 2% over 3 cycles).
Protocol: Robotic Viscosity and Injection Force Profiling for Biologics
1. Objective: To characterize the injectability of high-concentration biologic formulations (e.g., mAbs) and identify parameters that minimize injection site pain using automated force analysis.
2. Methodology:
- The robotic system is equipped with a force transducer and a micro-syringe filled with the test formulation.
- The platform automates a series of injections through different gauges of subcutaneous injection needles into a simulated tissue matrix.
- It records the force versus displacement profile for each injection, calculating key metrics like glide force and maximum breakout force.
- This data is correlated with formulation viscosity and composition. The DBTL cycle can then be used to optimize excipients (e.g., surfactants, hyaluronidase) to reduce injection forces and mitigate injection site pain, a key barrier to patient adherence [7].
Workflow Visualization
The following diagrams, generated with Graphviz using the specified color palette and contrast rules, illustrate the core logical relationships and experimental workflows described in this note.
Diagram 1: Automated DBTL Cycle for Formulation
Diagram 2: Drug Delivery Bottleneck Logic
What is the DBTL Cycle?
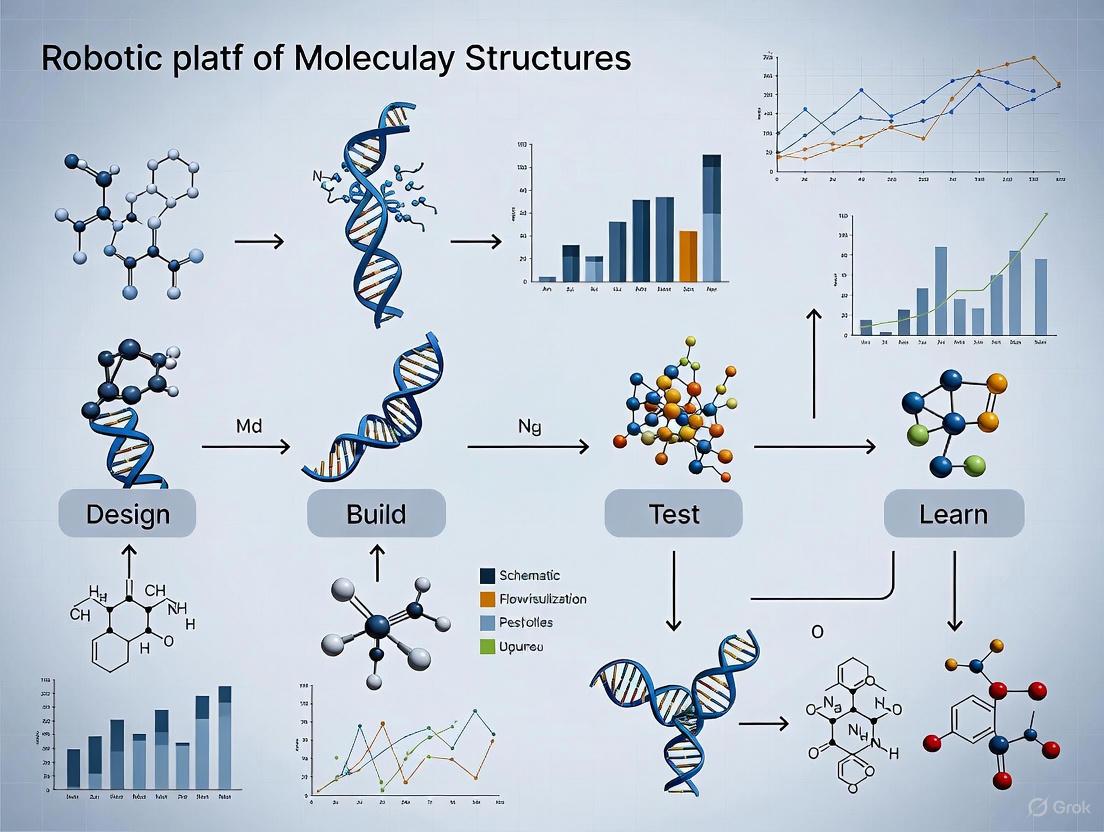
The Design-Build-Test-Learn (DBTL) cycle is a systematic, iterative framework central to synthetic biology and metabolic engineering for developing and optimizing biological systems [8]. Its power lies in the structured repetition of four key phases, enabling researchers to efficiently engineer organisms for specific functions, such as producing biofuels, pharmaceuticals, or other valuable compounds [8] [9].
The cycle begins with Design, where biological components are rationally selected and modelled. This is followed by Build, where the genetic designs are physically assembled and inserted into a host organism. Next, the Test phase involves analyzing the performance of the engineered system in functional assays. Finally, the Learn phase uses data analysis, often supported by machine learning, to extract insights that inform the design for the next cycle, creating a continuous loop of improvement [8] [9] [10].
Automation is a key enabler for the DBTL cycle, with robotic platforms—or biofoundries—dramatically increasing throughput, reliability, and reproducibility while reducing time and labor across all phases [11] [12].
The Four Phases of the DBTL Cycle in Detail
Design
The Design phase involves the rational selection and modelling of biological parts to create a genetic blueprint.
- Objective: To create a detailed genetic design that is predicted to achieve a desired function, such as optimizing metabolic flux toward a valuable product [9].
- Key Activities:
- Rational Design: Using prior knowledge to select DNA parts (e.g., promoters, coding sequences) [10].
- In Silico Modelling: Employing kinetic models to simulate pathway behavior and predict outcomes before physical assembly [9].
- Library Design: Planning combinatorial libraries of genetic variants to explore a design space, for example, by varying promoter strengths or ribosome binding sites (RBS) to tune enzyme expression levels [9] [10].
- Automation & Tools: Automated design software and data management systems help manage the complexity of designing large variant libraries [10] [11].
Build
The Build phase is the physical construction of the designed genetic elements and their introduction into a host organism.
- Objective: To accurately and efficiently assemble the designed genetic constructs and create microbial strain libraries [8] [11].
- Key Activities:
- DNA Assembly: Using modular cloning techniques (e.g., Golden Gate assembly) to piece together DNA fragments [8].
- Strain Engineering: Introducing the assembled constructs into a host chassis, such as E. coli or Corynebacterium glutamicum, via transformation [10] [11].
- Verification: Confirming the correct assembly of constructs using colony qPCR or Next-Generation Sequencing (NGS) [8].
- Automation & Tools: Liquid handling robots execute high-throughput molecular cloning, drastically reducing manual labor and enabling the construction of large, diverse strain libraries [8] [11].
Test
The Test phase involves culturing the built strains and assaying their performance to generate quantitative data.
- Objective: To characterize the functional performance of engineered strains under controlled conditions [11].
- Key Activities:
- High-Throughput Cultivation: Growing strain variants in automated microbioreactor systems (e.g., BioLector) that monitor biomass, pH, and dissolved oxygen [11].
- Product Assay: Sampling cultures and using analytical methods (e.g., HPLC, photometric assays) to measure key performance indicators like product titer, yield, and productivity (TYR) [11] [13].
- Functional Screening: Testing for specific properties, such as enzyme activity retained after thermal stress [13].
- Automation & Tools: Integrated robotic platforms handle everything from inoculating cryo-stocks to running analytical assays, enabling fully autonomous, consecutive cultivation experiments [11].
Learn
The Learn phase is the critical step where experimental data is analyzed to generate insights for the next DBTL cycle.
- Objective: To identify the relationships between genetic design and functional performance, thereby learning how to improve subsequent designs [9] [10].
- Key Activities:
- Data Integration: Consolidating data from the Test phase for analysis [11].
- Machine Learning (ML): Training ML models (e.g., Gaussian process regression, random forest) on the experimental data to predict the performance of new, untested designs [9] [13].
- Recommendation: Using optimization algorithms (e.g., Bayesian optimization) to propose a new set of promising strain designs for the next DBTL cycle [9] [13].
- Automation & Tools: Data management systems and ML pipelines automate the analysis and recommendation process, closing the loop for autonomous cycling [11] [13].
Workflow Visualization: The Automated DBTL Cycle
The following diagram illustrates how the DBTL cycle is implemented on an automated robotic platform, integrating the four phases into a seamless, iterative workflow.
Key Quantitative Data from DBTL Implementations
The effectiveness of the DBTL cycle is demonstrated by its application in various metabolic engineering projects. The table below summarizes key performance metrics from selected case studies.
Table 1: Performance Metrics from DBTL Cycle Case Studies
| Target Product / Goal | Host Organism | Key Engineering Strategy | Reported Outcome | Source |
|---|---|---|---|---|
| Dopamine | Escherichia coli | RBS library engineering to optimize enzyme expression levels [10] | 69.03 ± 1.2 mg/L, a 2.6-fold improvement over the state-of-the-art [10] | [10] |
| Enzyme Stabilizing Copolymers | In vitro with Glucose Oxidase, Lipase, HRP | Machine learning-guided design of protein-stabilizing random copolymers [13] | Identified copolymers providing significant Retained Enzyme Activity (REA) after thermal stress, outperforming a 504-copolymer systematic screen [13] | [13] |
| Autonomous Strain Characterization | Corynebacterium glutamicum | Integration of automated deep freezer, clean-in-place protocols [11] | Achieved highly reproducible main cultures with <2% relative deviation, enabling consecutive screening without human interaction [11] | [11] |
Detailed Experimental Protocol: A Representative DBTL Workflow
This protocol outlines the key steps for an automated DBTL cycle to optimize a metabolic pathway for product formation, as applied in recent studies [10] [11].
Phase 1: Design of a Combinatorial DNA Library
- Objective: Create a library of genetic designs to explore variations in enzyme expression levels.
- Procedure:
- Define Target Genes: Identify the genes of the metabolic pathway to be optimized (e.g., hpaBC and ddc for dopamine production) [10].
- Select Modulation Strategy: Choose a method for tuning gene expression, such as designing a library of Ribosome Binding Sites (RBS) with varying Shine-Dalgarno sequences [10].
- In Silico Design: Use computational tools (e.g., UTR Designer) to generate a diverse set of RBS sequences. The design space can include up to five different enzyme expression levels per gene [9] [10].
- Plan Assembly: Design oligonucleotides for the synthesis and assembly of the variant library into an appropriate expression plasmid (e.g., pET or pJNTN system) [10].
Phase 2: Automated Build of Strain Variants
- Objective: Construct the plasmid library and transform it into the production host at high throughput.
- Materials:
- Procedure:
- DNA Assembly: Program the liquid handler to set up assembly reactions in a 96-well format, mixing the designed oligonucleotides and plasmid backbone with the necessary enzymes [13].
- Transformation: Transfer the assembly reactions to the cloning strain for propagation. Isolate and verify the plasmids.
- Create Working Cell Bank (WCB): Transform the validated plasmid library into the production host. Culture the strains in a deep-well plate and prepare cryo-stocks (e.g., in 20% glycerol) for long-term storage at -20°C to -80°C within an integrated automated freezer [11].
Phase 3: High-Throughput Test of Strain Performance
- Objective: Cultivate strain variants and measure product formation automatically.
- Materials:
- Procedure:
- Inoculate Precultures: The robotic platform thaws WCBs and uses them to inoculate preculture medium in dedicated wells of a microtiter plate (MTP). The precultures are grown to a target optical density [11].
- Start Main Cultures: The platform automatically inoculates the main cultures in the BioLector MTP from the precultures.
- Monitor Cultivation: Run the BioLector to continuously monitor biomass, pH, and dissolved oxygen throughout the batch cultivation.
- Sample and Assay: At a defined timepoint or trigger, the robot performs non-invasive sampling of the culture broth. It then conducts a photometric or other assay in a separate assay plate to determine the product titer [11] [13].
Phase 4: Learn and Recommend New Designs
- Objective: Analyze data to build a predictive model and select the best strains for the next cycle.
- Procedure:
- Data Consolidation: Compile all performance data (e.g., final product titer) with the corresponding genetic design (e.g., RBS sequence) into a single dataset.
- Train Machine Learning Model: Use the compiled dataset to train a supervised learning model, such as Gaussian Process Regression (GPR) or Random Forest, to predict strain performance from genetic features [9] [13].
- Propose New Designs: Apply an optimization algorithm (e.g., Bayesian Optimization) to the trained model. The algorithm will propose a new batch of genetic designs that are predicted to have high performance, balancing exploration of new regions of the design space with exploitation of known promising areas [9] [13].
- Iterate: Return to Phase 1, using the new recommendations to initiate the next DBTL cycle.
The Scientist's Toolkit: Essential Research Reagents and Platforms
A successful automated DBTL pipeline relies on a suite of integrated reagents, tools, and equipment.
Table 2: Key Research Reagent Solutions and Platforms for Automated DBTL
| Item | Function / Application | Example Specifications / Notes |
|---|---|---|
| Liquid Handling Robot | Automates pipetting steps in DNA assembly, transformation, and assay setup. | Hamilton MLSTARlet [13]; Capable of handling 96- and 384-well plates. |
| Automated Deep Freezer | Provides on-demand, autonomous access to cryo-preserved Working Cell Banks. | LiCONiC; Maintains -20°C to -80°C; Integrated via mobile cart [11]. |
| Microbioreactor System | Enables parallel, monitored cultivation of hundreds of strain variants. | BioLector Pro; Monitors biomass, DO, pH in microtiter plates [11]. |
| RBS Library | Fine-tunes translation initiation rate and relative gene expression in synthetic pathways. | Library of Shine-Dalgarno sequence variants; Designed with UTR Designer [10]. |
| Expression Plasmid System | Vector for hosting and expressing the synthetic genetic construct in the host organism. | pET or pJNTN plasmid system; Compatible with inducible promoters (e.g., IPTG-inducible) [10]. |
| Cell-Free Protein Synthesis (CFPS) System | Crude cell lysate for rapid in vitro testing of enzyme expression and pathway function. | Bypasses whole-cell constraints; used for preliminary, knowledge-driven design [10]. |
The contemporary laboratory is undergoing a profound transformation, evolving from a space characterized by manual processes into an intricate, interconnected data factory [14]. This shift is orchestrated through the seamless integration of three foundational technologies: advanced robotics, artificial intelligence (AI), and sophisticated data analytics. Together, they form an operational triad that enables unprecedented levels of efficiency, reproducibility, and discovery. The core framework uniting these elements is the automated Design-Build-Test-Learn (DBTL) cycle, which applies an engineering approach to biological discovery and optimization [15] [16]. In this paradigm, robotics acts as the physical engine for execution, AI serves as the intelligent controller for design and analysis, and data analytics provides the essential insights that fuel iterative learning, creating a continuous loop of innovation.
Core Principles of the Automated Design-Build-Test-Learn (DBTL) Cycle
The automated DBTL cycle is a structured, iterative framework for the rapid development and optimization of biological systems, such as microbial strains for chemical production [16]. Its power lies in the automation and data-driven feedback connecting each phase.
- Design: In this initial phase, in silico tools are used to design genetic constructs or experimental plans. For metabolic engineering, this involves selecting enzymes and designing DNA parts with optimized regulatory elements (e.g., promoters, ribosome binding sites) using specialized software [16]. Designs can explore vast combinatorial libraries, which are then statistically reduced to a tractable number of constructs for testing.
- Build: This phase involves the physical construction of the designed genetic variants. Automated platforms, such as robotic liquid handlers, perform DNA assembly reactions (e.g., ligase cycling reaction) to build plasmids, which are then transformed into a microbial chassis. The process is supported by automated worklists and sample tracking [16].
- Test: The constructed strains are cultured in automated, high-throughput systems like 96-deepwell plate bioreactors. Target chemicals and intermediates are quantitatively screened using analytical techniques like UPLC-MS/MS. Data extraction and processing are automated with custom scripts [16].
- Learn: Data from the Test phase is analyzed using statistical methods and machine learning to identify the relationships between design parameters (e.g., promoter strength, gene order) and production titers. The insights gained directly inform the redesign of constructs in the next DBTL cycle, progressively optimizing the system [16].
Table 1: Quantitative Outcomes of an Automated DBTL Pipeline for Microbial Production
| DBTL Cycle | Target Product | Key Design Factors Explored | Initial Titer (mg L⁻¹) | Optimized Titer (mg L⁻¹) | Fold Improvement |
|---|---|---|---|---|---|
| Cycle 1 [16] | (2S)-Pinocembrin | Vector copy number, promoter strength, gene order | 0.14 | - | - |
| Cycle 2 [16] | (2S)-Pinocembrin | Refined promoter placement and gene order | - | 88 | ~500 |
Detailed Protocol: Implementing an Automated DBTL Cycle for Microbial Metabolic Engineering
This protocol details the application of an automated DBTL pipeline to enhance the microbial production of fine chemicals, using the flavonoid (2S)-pinocembrin in Escherichia coli as a model system [16].
Application Note Objective
To establish a compound-agnostic, automated DBTL pipeline for the rapid discovery and optimization of biosynthetic pathways in a microbial chassis, achieving a 500-fold increase in (2S)-pinocembrin production titers over two iterative cycles [16].
Experimental Materials and Reagents
Table 2: Research Reagent Solutions for Automated DBTL Protocol
| Item Name | Function / Description | Application in Protocol |
|---|---|---|
| RetroPath [16] | In silico pathway selection tool | Identifies potential enzymatic pathways for the target compound. |
| Selenzyme [16] | Automated enzyme selection software | Selects specific enzyme sequences for the designed pathway. |
| PartsGenie [16] | DNA part design software | Designs reusable DNA parts with optimized RBS and codon-optimized coding regions. |
| Ligase Cycling Reaction (LCR) [16] | DNA assembly method | Used by the robotic platform to assemble multiple DNA parts into the final pathway construct. |
| E. coli DH5α [16] | Microbial production chassis | The host organism for the expression of the constructed flavonoid pathway. |
| UPLC-MS/MS [16] | Analytical screening platform | Provides quantitative, high-resolution data for the target product and key intermediates. |
Equipment and Software Configuration
- Robotics Platforms: Automated liquid handlers for DNA assembly and colony picking. A 96-deepwell plate system for microbial cultivation [16].
- Data Management: A centralized repository (e.g., JBEI-ICE) for storing DNA part designs, plasmid assemblies, and sample tracking with unique identifiers [16].
- Analytical Instrumentation: Ultra-performance liquid chromatography coupled to tandem mass spectrometry (UPLC-MS/MS) for high-throughput metabolite screening [16].
Step-by-Step Methodology
Phase 1: Design
- Pathway Selection: For the target compound (e.g., (2S)-pinocembrin), use RetroPath to identify a biosynthetic pathway from a core precursor (e.g., L-phenylalanine) [16].
- Enzyme Selection: Input the identified enzymatic reactions into Selenzyme to select specific enzyme coding sequences from source organisms [16].
- Genetic Design: Use PartsGenie to design the DNA parts, including optimization of ribosome-binding sites (RBS) and codon usage for the host organism [16].
- Library Design & Reduction: Combine genes and regulatory parts (promoters of varying strength) into a large combinatorial library. Apply Design of Experiments (DoE) to reduce the library to a statistically representative subset for testing [16].
Phase 2: Build
- DNA Synthesis: Source the designed coding sequences via commercial DNA synthesis [16].
- Automated Assembly Preparation: Use custom software to generate assembly recipes and robotics worklists for the Ligase Cycling Reaction (LCR) [16].
- Robotic Assembly: Execute the LCR assembly on a robotic platform [16].
- Transformation & QC: Transform the assembled constructs into the production chassis (e.g., E. coli). Quality-control candidate clones through automated plasmid purification, restriction digest, and sequence verification [16].
Phase 3: Test
- High-Throughput Cultivation: Inoculate verified constructs into 96-deepwell plates for automated growth and induction under controlled conditions [16].
- Metabolite Extraction: Automatically extract metabolites from the cultures.
- Quantitative Screening: Analyze the extracts using UPLC-MS/MS to quantify the titers of the target product (e.g., (2S)-pinocembrin) and key pathway intermediates (e.g., cinnamic acid) [16].
- Data Processing: Use custom R scripts for automated data extraction and processing [16].
Phase 4: Learn
- Statistical Analysis: Apply statistical analysis (e.g., analysis of variance) to the production data to identify the main design factors (e.g., vector copy number, promoter strength) that significantly influence product titer [16].
- Machine Learning: Use the results to train models that predict the performance of new design variants.
- Redesign: Use these insights to define the parameters for the next DBTL cycle, focusing on the most impactful factors to achieve further optimization [16].
Data Analysis and Interpretation
In the (2S)-pinocembrin case study, the first DBTL cycle identified vector copy number as the strongest positive factor affecting production, followed by the promoter strength upstream of the chalcone isomerase (CHI) gene [16]. The accumulation of the intermediate cinnamic acid indicated that phenylalanine ammonia-lyase (PAL) activity was not a bottleneck. These findings directly informed the second cycle's design, which focused on high-copy-number vectors and specific promoter placements, culminating in a final titer of 88 mg L⁻¹ [16].
The Integrated Technological Framework
The Role of Robotics and Automation
Robotics provides the physical engine for the automated lab, moving far beyond simple sample conveyance to execute complex, end-to-end workflows [14].
- Robotic Arms and Autonomous Mobile Robots (AMRs): Highly dexterous robotic arms mimic human manipulation skills for tasks like micro-pipetting and plating, while AMRs handle logistics, transporting materials between stations to ensure 24/7 operational continuity [14].
- Humanoid Robots: An emerging trend involves the use of affordable, general-purpose humanoid robots that can perform tasks in environments designed for humans, such as organizing equipment or interacting with touchscreens [14].
The Centrality of Data and AI
In the laboratory of the future, data is the primary asset, and every process is designed around its generation, capture, and analysis [14].
- FAIR Data and Interoperability: A major challenge is the fragmentation of data across disparate systems. The solution involves creating integrated data repositories where instruments automatically feed standardized, metadata-rich data, often facilitated by robust Laboratory Information Management Systems (LIMS) [14] [17].
- AI and Machine Learning: AI algorithms manage experimental design, identify subtle trends, predict optimal conditions, and flag anomalies. They are crucial for analyzing the massive datasets generated in the "Learn" phase of the DBTL cycle [14] [16].
- Edge AI for Operational Resilience: To overcome the latency and internet dependence of cloud computing, leading labs are deploying Edge AI—high-performance computing resources on-premises. This enables real-time feedback to robotic systems, enhances data security, and ensures core functions continue during network outages [14].
Standardization and Open-Source Tools
The full potential of the automated lab is realized through standardization and collaboration. The development of open-source tools for tasks such as the automated standardization of laboratory units in electronic records is key to ensuring data interoperability and reducing analytic bias in large-scale datasets [18]. Furthermore, the community is moving towards an open, platform-based approach, such as a laboratory operating system that orchestrates the entire lab ecosystem through partnership and shared standards [17].
Workflow Visualization
Diagram 1: Automated DBTL Cycle for Metabolic Engineering.
Diagram 2: Hybrid AI & Data Infrastructure for the Automated Lab.
Building the Self-Driving Laboratory: A Practical Guide to Integrating Robotic Platforms and AI
The Design-Build-Test-Learn (DBTL) cycle represents a core engineering framework in synthetic biology, enabling the systematic development and optimization of microbial strains for the production of fine chemicals and therapeutics. The manual execution of this cycle is often slow and labor-intensive, constraining the exploration of complex biological design spaces. Biofoundries address this bottleneck by integrating computer-aided design, synthetic biology tools, and robotic automation to create accelerated, automated DBTL pipelines [19] [16]. These facilities are structured research and development systems where biological design, validated construction, functional assessment, and mathematical modeling are performed following the DBTL engineering cycle [20]. The full automation of DBTL cycles, central to synthetic biology, is becoming a cornerstone for next-generation biomanufacturing and a sustainable bioeconomy [10].
Automating the DBTL cycle brings transformative advantages, including enhanced reproducibility, dramatically increased throughput, and the generation of high-quality, machine-learnable data for subsequent design iterations [15]. This article details the architecture of an automated DBTL workflow, from computational design to physical strain testing, providing application notes and detailed protocols tailored for research environments utilizing robotic platforms.
To manage the complexity of automated biological experimentation, a standardized abstraction hierarchy is essential for interoperability and clear communication between researchers and automated systems. This hierarchy organizes biofoundry activities into four distinct levels, effectively streamlining the DBTL cycle [20].
- Level 0: Project - This is the highest level, representing the overall goal or user request, such as "Develop a high-titer dopamine production strain in E. coli" [20] [10].
- Level 1: Service/Capability - This level defines the specific, modular services required to complete the project. Examples include "Modular DNA Assembly" or "AI-driven Protein Engineering" [20].
- Level 2: Workflow - Each service is broken down into sequential, DBTL-stage-specific workflows. These are abstracted, reusable modules such as "DNA Oligomer Assembly (Build)" or "High-Throughput Screening (Test)" [20].
- Level 3: Unit Operation - This is the lowest level, comprising the individual experimental or computational tasks executed by hardware or software. Examples include "Liquid Transfer" by a liquid-handling robot or "Protein Structure Generation" by RFdiffusion software [20].
This framework allows biologists to operate at higher abstraction levels (Project, Service) without needing detailed knowledge of the hardware-specific unit operations, while engineers can focus on robust execution at the lower levels [20].
Phase 1: Design – In Silico Pathway and Part Selection
The automated DBTL cycle begins with the Design phase, where computational tools are used to select and model the biological system to be constructed.
Application Note: Automated Enzyme Selection and Pathway Design
For any target compound, in silico tools enable the automated selection of candidate enzymes and pathway designs. The RetroPath tool can be used for automated enzyme selection, while Selenzyme is available for enzyme selection [16]. For a target like (2S)-pinocembrin, these tools can automatically select a pathway comprising enzymes such as phenylalanine ammonia-lyase (PAL), 4-coumarate:CoA ligase (4CL), chalcone synthase (CHS), and chalcone isomerase (CHI) [16]. Following enzyme selection, the PartsGenie software facilitates the design of reusable DNA parts, simultaneously optimizing bespoke ribosome-binding sites (RBS) and codon-optimizing enzyme coding regions [16].
Protocol: Designing a Combinatorial Library with Design of Experiments (DoE)
Objective: To create a manageable, representative library of genetic constructs for experimental testing that efficiently explores a large design space.
- Define Variables: Identify key genetic variables to test (e.g., promoter strengths, RBS sequences, gene order in an operon, plasmid copy number) [16].
- Generate Full Combinatorial Library: In silico, generate all possible combinations of the variables. For example, varying four genes' order (24 permutations), promoter strengths (3 levels), and vector backbone (4 types) can generate 2,592 possible configurations [16].
- Apply DoE Reduction: Use statistical methods like orthogonal arrays combined with a Latin square to reduce the library to a tractable number of representative constructs. This can achieve a high compression ratio (e.g., 162:1, from 2592 to 16 constructs) [16].
- Generate Assembly Instructions: Use software (e.g., PlasmidGenie) to automatically generate assembly recipes and robotics worklists for the Build phase. All designs should be deposited in a centralized repository like JBEI-ICE for sample tracking [16].
Phase 2: Build – Automated Genetic Construction
The Build phase translates digital designs into physical DNA constructs and engineered microbial strains. Automation here is critical for achieving high throughput and reproducibility.
Application Note: High-Throughput Yeast Strain Construction
A modular, automated protocol for the high-throughput transformation of Saccharomyces cerevisiae on a Hamilton Microlab VANTAGE platform can achieve a throughput of ~2,000 transformations per week, a 10-fold increase over manual operations [19]. The workflow was programmed using Hamilton VENUS software and divided into discrete steps: "Transformation set up and heat shock," "Washing," and "Plating" [19]. A key feature is the integration of off-deck hardware (plate sealer, peeler, and thermal cycler) via the central robotic arm, enabling fully hands-free operation during the critical heat-shock step [19]. This pipeline is compatible with downstream automation, such as colony picking using a QPix 460 system [19].
Protocol: Automated Yeast Transformation in 96-Well Format
Objective: To build a library of engineered yeast strains via automated, high-throughput transformation.
Table 1: Key Reagent Solutions for Automated Yeast Transformation
| Research Reagent | Function in Protocol |
|---|---|
| Competent S. cerevisiae Cells | Engineered host strain prepared for transformation. |
| Plasmid DNA Library | Contains genes for pathway optimization or target protein expression. |
| Lithium Acetate (LiOAc) | Component of transformation mix, permeabilizes the cell wall. |
| Single-Stranded DNA (ssDNA) | Blocks DNA-binding sites on cell surfaces to reduce non-specific plasmid binding. |
| Polyethylene Glycol (PEG) | Promotes plasmid DNA uptake by the competent cells. |
| Selective Agar Plates | Solid medium containing auxotrophic or antibiotic selection for transformed cells. |
- Deck Setup: Load the robotic deck with labware containing competent yeast cells, plasmid DNA library, and reagents (LiOAc, ssDNA, PEG) according to a predefined deck layout [19].
- Transformation Mix Setup: The robot pipettes the transformation mix (LiOAc/ssDNA/PEG) and plasmid DNA into a 96-well plate containing the competent cells. Critical: Optimize liquid classes for viscous reagents like PEG by adjusting aspiration/dispense speeds and air gaps to ensure volume accuracy [19].
- Heat Shock: The robotic arm moves the sample plate to an off-deck thermal cycler for a programmed heat-shock incubation (e.g., 42°C). The plate is sealed and peeled automatically during this process [19].
- Washing and Plating: Post heat-shock, the robot performs washing steps and finally plates the transformation mixture onto selective agar plates [19].
- Colony Picking: After incubation, transformed colonies are picked using an automated colony picker (e.g., QPix 460) for inoculation into culture plates for the Test phase [19].
Phase 3: Test – High-Throughput Screening and Analytics
The Test phase involves cultivating the engineered strains and quantifying their performance, such as the production of a target molecule.
Application Note: Screening for Verazine Production
An automated pipeline was used to screen a library of 32 genes overexpressed in a verazine-producing S. cerevisiae strain. The library included genes from native sterol biosynthesis, heterologous verazine pathways, and those related to sterol transport and storage [19]. Each engineered strain was cultured in a high-throughput 96-deep-well plate format with six biological replicates. A rapid, automated chemical extraction method based on Zymolyase-mediated cell lysis and organic solvent extraction was developed, followed by analysis via a fast LC-MS method that reduced the analytical runtime from 50 to 19 minutes [19]. This enabled efficient quantification of verazine titers across the ~200-sample library, identifying several genes (e.g., erg26, dga1, cyp94n2) that enhanced production by 2- to 5-fold [19].
Protocol: High-Throughput Cultivation and Metabolite Analysis
Objective: To test the performance of a strain library by measuring the titer of a target metabolite.
- Inoculation and Cultivation: Using a liquid handler, inoculate sterile culture medium in 96-deep-well plates from the picked colonies. Incubate plates in a controlled, high-capacity shaking incubator to support cell growth and product formation [19] [16].
- Automated Metabolite Extraction:
- Cell Lysis: Transfer an aliquot of culture to a new plate and add a lysis buffer (e.g., containing Zymolyase for yeast) [19]. Incubate to degrade cell walls.
- Solvent Extraction: Add an organic solvent (e.g., ethyl acetate) to extract the target metabolite from the lysate. The plate can be sealed and mixed thoroughly by the robot [19].
- Phase Separation: Centrifuge the plate to achieve phase separation.
- LC-MS Analysis:
- The robotic system prepares the injection plate, possibly including a dilution or filtration step.
- A liquid handler interfaces with the LC-MS system, injecting samples for analysis.
- Use a fast, optimized LC-MS method (e.g., 19-minute runtime) for rapid separation and quantification of the target compound [19].
- Data Extraction: Use custom-developed, open-source R scripts for automated data extraction and processing of the raw LC-MS results to calculate titers for each strain [16].
Phase 4: Learn – Data Analysis and Model Refinement
The Learn phase closes the DBTL loop by transforming experimental data into actionable knowledge for the next design iteration.
Application Note: Statistical and Machine Learning Analysis
After testing a reduced library of 16 pathway constructs for pinocembrin production in E. coli, statistical analysis of the titers identified the main factors influencing production [16]. Vector copy number was the strongest significant factor, followed by the promoter strength upstream of the CHI gene [16]. This knowledge-driven approach informs the constraints for the next DBTL cycle. More advanced machine learning (ML) techniques can be applied to navigate the design space more efficiently, identifying non-intuitive relationships between genetic parts and pathway performance [15] [21]. The application of a "knowledge-driven DBTL" cycle, which incorporates upstream in vitro testing in cell lysate systems to gain mechanistic insights before in vivo strain construction, has also been shown to efficiently guide RBS engineering for optimizing dopamine production [10].
Protocol: Statistical Analysis for Pathway Bottleneck Identification
Objective: To identify key genetic and regulatory factors limiting product yield from a screened library.
- Data Compilation: Compile production titers and metadata (e.g., promoter strength, RBS sequence, gene order) for all constructs in the tested library into a single data table.
- Statistical Modeling: Perform statistical analysis, such as Analysis of Variance (ANOVA), to determine the P-values associated with each design factor, quantifying its impact on the final titer [16].
- Identify Bottlenecks: Rank factors by their statistical significance. A highly significant factor (e.g., a specific promoter strength) with a positive effect indicates a potential bottleneck when sub-optimal.
- Define New Design Space: Use the results to refine the design space for the next cycle. For example, if a high-copy number plasmid was beneficial, constrain all future designs to use it. Focus combinatorial variation on the most influential factors [16].
Integrated Case Study: Optimizing Dopamine Production in E. coli
The application of a knowledge-driven DBTL cycle for dopamine production in E. coli demonstrates the power of an integrated, automated workflow [10]. The project aim (Level 0: Project) was to develop an efficient dopamine production strain.
Table 2: Quantitative Outcomes of Automated DBTL Implementation
| DBTL Metric | Manual / Low-Throughput Workflow | Automated / High-Throughput Workflow | Source |
|---|---|---|---|
| Yeast Transformation Throughput | ~200 transformations per week | ~2,000 transformations per week | [19] |
| Pinocembrin Production Titer (after 2 DBTL cycles) | N/A (Starting point) | 88 mg L⁻¹ (500-fold improvement) | [16] |
| Dopamine Production Titer | 27 mg L⁻¹ (State-of-the-art) | 69 mg L⁻¹ (2.6-fold improvement) | [10] |
| LC-MS Analysis Runtime | 50 minutes per sample | 19 minutes per sample | [19] |
- Design: The pathway from l-tyrosine to dopamine via l-DOPA was designed using enzymes HpaBC and Ddc [10].
- Build (In Vitro): The pathway was first tested in a cell-free protein synthesis (CFPS) system to rapidly assess enzyme expression and activity without cellular constraints, generating initial knowledge [10].
- Build (In Vivo) & Test: The knowledge from the CFPS system was translated to an in vivo environment via high-throughput RBS engineering to fine-tune the relative expression of hpaBC and ddc. An automated platform was used to build and screen the RBS library [10].
- Learn: Analysis of the strain performance data identified the impact of GC content in the Shine-Dalgarno sequence on translation efficiency, leading to the development of a strain producing 69.03 ± 1.2 mg/L of dopamine, a 2.6-fold improvement over the state of the art [10].
The 'Design' phase represents a paradigm shift in drug discovery, moving from traditional, labor-intensive methods to automated, AI-driven workflows. By leveraging generative models, researchers can now rapidly design novel compounds with desired pharmacological properties, thereby compressing the early-stage discovery timeline from years to months [22]. This approach is particularly powerful when integrated into robotic platforms that automate the entire Design-Build-Test-Learn (DBTL) cycle, creating a closed-loop system for iterative compound optimization [22]. AI models excel at navigating the vast complexity of chemical space, where the analysis of millions of variables and extensive datasets enables the identification of meaningful patterns that would be impossible for human researchers to discern efficiently [23]. This capability is transforming how pharmaceutical companies approach therapeutic development, with multiple AI-designed small-molecule drug candidates now reaching Phase I trials in a fraction of the typical 5-year timeline required for traditional discovery and preclinical work [22].
Key AI Approaches and Architectures
Large Property Models (LPMs)
Large Property Models represent a fundamental breakthrough in solving the inverse design problem—finding molecular structures that match a set of desired properties. Unlike traditional forward models that predict properties from structures, LPMs directly learn the conditional probability P(molecule|properties) by training on extensive chemical datasets with multiple property annotations [24]. The core hypothesis behind LPMs is that the property-to-structure mapping becomes unique when a sufficient number of properties are supplied during training, effectively teaching the model "general chemistry" before focusing on specific application-relevant properties [24]. These models demonstrate that including abundant chemical property data during training, even for off-target properties, significantly improves the model's ability to generate valid, synthetically feasible structures that match targeted property profiles [24].
Multimodal Biochemical Language Models
This advanced architecture combines protein language models (PLMs) with chemical language models (CLMs) to enable generative design of active compounds with desired potency directly from target protein sequences [25]. The model operates by first generating embeddings from protein sequences using a pre-trained PLM (e.g., ProtT5-XL-Uniref50), then conditions a transformer on both these protein embeddings and numerical potency values to generate corresponding compound structures in SMILES format [25]. This approach effectively learns mappings from combined protein sequence and compound potency value embeddings to active compounds, demonstrating proof-of-concept for generating structurally diverse candidate compounds with target-specific activity [25].
Generative Adversarial Networks and Variational Autoencoders
Generative adversarial networks (GANs) and variational autoencoders (VAEs) provide complementary strengths for molecular generation. The VGAN-DTI framework integrates both approaches: VAEs capture latent molecular representations and produce synthetically feasible molecules, while GANs introduce adversarial learning to enhance structural diversity and generate novel chemically valid molecules [26]. This synergy ensures precise interaction modeling while optimizing both feature extraction and molecular diversity, ultimately improving drug-target interaction (DTI) prediction accuracy when combined with multilayer perceptrons (MLPs) for interaction classification [26].
Performance Comparison of AI Drug Discovery Platforms
Table 1: Leading AI-Driven Drug Discovery Platforms and Their Performance Metrics
| Company/Platform | AI Approach | Key Therapeutic Areas | Reported Efficiency Gains | Clinical Stage |
|---|---|---|---|---|
| Exscientia | Generative AI + "Centaur Chemist" | Oncology, Immuno-oncology, Inflammation | 70% faster design cycles; 10x fewer synthesized compounds [22] | Multiple Phase I/II trials [22] |
| Insilico Medicine | Generative AI | Idiopathic pulmonary fibrosis (IPF) | Target to Phase I in 18 months [22] | Phase I trials [22] |
| Recursion | Phenomics + AI | Multiple | Integrated platform post-Exscientia merger [22] | Multiple clinical programs [22] |
| BenevolentAI | Knowledge graphs | Multiple | Target identification and validation [22] | Clinical stages [22] |
| Schrödinger | Physics-based simulations + ML | Multiple | Accelerated lead optimization [22] | Clinical stages [22] |
Quantitative Performance of AI Generative Models
Table 2: Performance Metrics of AI Generative Models for Molecular Design
| Model Type | Key Performance Metrics | Dataset | Architecture |
|---|---|---|---|
| Large Property Models (LPMs) | Reconstruction accuracy increases with number of properties; Enables inverse design [24] | 1.3M molecules from PubChem, 23 properties [24] | Transformers for property-to-molecular-graph task [24] |
| Biochemical Language Model | Generates compounds with desired potency from target sequences; Structurally diverse outputs [25] | 87,839 compounds from ChEMBL, 1575 activity classes [25] | ProtT5 PLM + conditional transformer [25] |
| VGAN-DTI | 96% accuracy, 95% precision, 94% recall, 94% F1 score for DTI prediction [26] | BindingDB | GAN + VAE + MLP integration [26] |
Experimental Protocols
Protocol: Implementing Large Property Models for Inverse Molecular Design
Purpose: To generate novel molecular structures with targeted properties using LPMs. Materials:
- Hardware: High-performance computing cluster with GPU acceleration
- Software: Python with deep learning frameworks (PyTorch/TensorFlow)
- Data: Curated dataset of molecular structures with multiple property annotations
Procedure:
- Data Preparation: Curate a dataset of molecular structures with associated properties. The LPM implementation by Jin et al. utilized 1.3 million molecules from PubChem with 23 calculated properties including dipole moment, HOMO-LUMO gap, logP, and topological polar surface area [24].
- Model Architecture Selection: Implement a transformer architecture specialized for the property-to-molecular-graph task. The model should accept a vector of property values as input and generate molecular structures (as SMILES or graph representations) as output [24].
- Training Protocol: Train the model using a dataset with diverse molecular representations and property annotations. Monitor reconstruction accuracy as a function of the number of properties supplied during training [24].
- Sampling and Generation: Query the trained model with target property vectors to generate novel molecular structures. Validate generated structures for chemical validity and property matching using independent assessment methods [24].
- Iterative Refinement: Incorporate generated compounds into the DBTL cycle, using experimental results to refine the model through continuous learning.
Protocol: Target-Specific Compound Generation Using Biochemical Language Models
Purpose: To generate potent compounds for specific protein targets using sequence and potency information. Materials:
- Protein sequences in FASTA format
- Potency data (pKi values) for known actives
- Pre-trained protein language model (ProtT5-XL-Uniref50)
- Chemical language model component
Procedure:
- Data Curation: Collect high-confidence bioactivity data from sources like ChEMBL, ensuring direct interactions (assay confidence score 9) and consistent potency measurements (e.g., Ki values converted to pKi) [25].
- Protein Sequence Embedding: Generate embeddings for target protein sequences using the pre-trained ProtT5 PLM, which captures structural and functional information from ultra-large sequence datasets [25].
- Model Training: Train a conditional transformer to learn mappings from combined protein sequence embeddings and potency value embeddings to corresponding compound structures (SMILES strings) [25].
- Conditional Generation: Generate novel compounds by providing target sequence embeddings and desired potency values to the trained model.
- Validation: Evaluate generated compounds through docking studies, synthetic accessibility scoring, and assessment of structural diversity relative to known actives.
Protocol: Enhancing Drug-Target Interaction Prediction with VGAN-DTI
Purpose: To accurately predict drug-target interactions using a hybrid generative approach. Materials:
- Binding affinity data from BindingDB
- Molecular structures in SMILES format
- Target protein information
Procedure:
- Data Preparation: Preprocess drug-target interaction data from BindingDB, representing molecular structures as fingerprint vectors [26].
- VAE Implementation: Configure the VAE component with an encoder network that maps molecular features to latent-space distributions (mean and log-variance), and a decoder network that reconstructs molecular structures from latent representations [26].
- GAN Implementation: Implement the GAN component with a generator that creates molecular structures from random latent vectors and a discriminator that distinguishes between real and generated molecules [26].
- MLP Integration: Train multilayer perceptrons on generated molecular features to predict binding affinities and classify drug-target interactions [26].
- Model Validation: Evaluate the complete VGAN-DTI framework using accuracy, precision, recall, and F1 score metrics, comparing against baseline methods [26].
Workflow Visualization
AI-Driven DBTL Cycle for Compound Design
Biochemical Language Model Architecture
Multimodal Biochemical Language Model
The Scientist's Toolkit: Research Reagent Solutions
Table 3: Essential Research Reagents and Computational Tools for AI-Driven Compound Design
| Resource | Type | Function in AI-Driven Design | Example Sources/Platforms |
|---|---|---|---|
| Curated Bioactivity Data | Dataset | Training and validating biochemical language models | ChEMBL, BindingDB [25] [26] |
| Pre-trained Protein Language Models | Software | Generating protein sequence embeddings for target-specific design | ProtT5-XL-Uniref50 from ProtTrans [25] |
| Molecular Property Calculators | Software/Tool | Generating training data for Large Property Models | GFN2-xTB, RDKit [24] |
| Automated Synthesis Platforms | Hardware | Translating AI-designed compounds to physical samples for testing | Robotics-mediated automation systems [22] |
| High-Throughput Screening | Assay Platform | Generating experimental data for AI model refinement | Phenotypic screening platforms [22] |
| Chemical Structure Representations | Data Format | Encoding molecular structures for AI processing | SMILES, SELFIES, Molecular graphs [24] [25] |
Within the framework of an automated Design-Build-Test-Learn (DBTL) cycle for research, the "Build" phase is critical for translating digital designs into physical biological entities. This phase encompasses the high-throughput construction of genetic constructs and the preparation of experimental cultures. The integration of robotic systems has transformed this stage from a manual, low-throughput bottleneck into a rapid, reproducible, and automated process [16]. Automation in the Build phase directly enhances the overall efficiency of the entire DBTL cycle, enabling the rapid prototyping of thousands of microbial strains or chemical synthesis pathways for discovery and optimization [15] [16]. This document details the application of high-throughput robotic systems for the synthesis and assembly of genetic parts into functional pathways within microbial hosts, providing detailed protocols and key resources.
High-Throughput Robotic Platforms for Synthesis and Assembly
Robotic systems applied in the "Build" phase can be categorized into several architectures, each offering distinct advantages for specific laboratory workflows.
Table 1: Key Robotic Platform Architectures for the "Build" Phase
| Platform Architecture | Key Characteristics | Typical Applications | Examples from Literature |
|---|---|---|---|
| Station-Based Automation | Integrated, specialized workstations for specific tasks (e.g., liquid handling, PCR) [27]. | Automated pathway assembly using ligase cycling reaction (LCR), sample preparation for sequencing, culture transformation [16]. | Chemspeed ISynth synthesizer for organic synthesis [28]. |
| Mobile Manipulator Systems | A free-roaming mobile robot navigates a lab, transferring samples between standard instruments [27] [28]. | End-to-end execution of multi-step experiments that involve synthesis, analysis, and sample management across different stationary instruments [27]. | Platform with mobile robots transporting samples between synthesizer, UPLC–MS, and NMR [28]. |
| Collaborative Robots (Cobots) | Robotic arms designed to work safely alongside humans in a shared workspace [29] [30]. | Repetitive but delicate tasks such as sample preparation, liquid handling, and pick-and-place operations in dynamic research environments [30]. | Used for tasks requiring flexibility, such as the production of personalized medicines [30]. |
The core application of these platforms in synthetic biology is the automated assembly of genetic pathways. A landmark study demonstrated a fully automated DBTL pipeline for optimizing microbial production of fine chemicals [16]. The Build stage involved:
- Automated DNA Assembly: Using robotic platforms to perform ligase cycling reaction (LCR) for pathway assembly based on computationally designed worklists [16].
- Clone Verification: Automated plasmid purification, restriction digest, and analysis via capillary electrophoresis, followed by sequence verification [16].
This automated Build process successfully constructed a representative library of 16 pathway variants, enabling a 500-fold improvement in the production titer of the flavonoid (2S)-pinocembrin in E. coli through two iterative DBTL cycles [16].
For chemical synthesis, the "robochemist" concept leverages mobile manipulators and robotic arms to perform core laboratory skills like pouring and liquid handling, moving beyond traditional stationary automation [27]. These systems can execute synthetic protocols written in machine-readable languages (e.g., XDL) through automated path-planning algorithms [27].
Detailed Experimental Protocol: Automated Pathway Assembly and Strain Construction
This protocol describes an automated workflow for building a combinatorial library of genetic pathway variants in a 96-well format, adapted from established automated DBTL pipelines [16].
Pre-Build Requirements: Design and DNA Synthesis
- Input from Design Phase: The process begins with a statistically reduced library of genetic designs from the "Design" phase. A custom software (e.g., PlasmidGenie) generates assembly recipes and robotics worklists [16].
- DNA Parts Preparation: Source DNA parts (e.g., promoters, genes, terminators) are either obtained commercially via synthesis or from repository libraries. Parts require preparation, typically via PCR, before robotic assembly [16].
Automated Build Procedure
Step 1: Robotic Reaction Setup
- Configure the Liquid Handler: Ensure the robotic liquid handling platform (e.g., equipped with a 96-channel head) is calibrated. Load labware: source plates containing DNA parts, a destination 96-well PCR plate for assemblies, and reagent reservoirs with nuclease-free water and LCR master mix.
- Transfer DNA Parts: Following the automated worklist, the robot transfers specified volumes of each DNA part (e.g., 1 µL of each plasmid or fragment at 10-20 ng/µL) into the corresponding wells of the destination PCR plate.
- Add Assembly Mix: The robot dispenses the LCR master mix (containing ligase, buffer, ATP) to each reaction well. The final reaction volume is 10 µL.
- Seal the Plate: Manually or robotically apply a thermal seal to the plate.
Step 2: Off-Deck Incubation and Transformation
- Perform Assembly Reaction: Transfer the sealed plate to a thermal cycler and run the LCR program (e.g., 5 minutes at 98°C, followed by 100 cycles of 10 seconds at 98°C and 1-4 minutes at 58°C) [16].
- Transform Host Cells: This step is currently performed off-deck. Aliquot competent E. coli cells (e.g., DH5α) into a 96-well assay plate. Transfer 1 µL of the completed LCR reaction into the cells, and perform a standard heat-shock transformation protocol.
- Plate for Colony Growth: Plate the transformation mixtures onto selective LB-agar plates, either manually or using an automated colony picker. Incubate overnight at 37°C.
Step 3: Automated Clone Verification
- Inoculate Cultures: Using a colony picker, inoculate single colonies into a 96-deepwell plate containing selective LB medium.
- Perform Automated Plasmid Prep: The robotic system executes a high-throughput plasmid purification protocol from the grown cultures.
- Analyze Constructs: The robot prepares analytical restriction digests of the purified plasmids. The digest products are then analyzed by an automated capillary electrophoresis system (e.g., Fragment Analyzer) to verify the correct assembly size.
- Sequence Verification: Plasmid samples identified with the correct restriction pattern are submitted for sequencing. The entire process, from cultured cells to sequence-verified constructs, is tracked using a laboratory information management system (LIMS) with unique sample IDs [16].
Table 2: Research Reagent Solutions for Automated Genetic Assembly
| Reagent / Material | Function / Application | Example Specification / Notes |
|---|---|---|
| Ligase Cycling Reaction (LCR) Master Mix | Enzymatically assembles multiple linear DNA fragments into a circular plasmid in a one-pot reaction [16]. | Preferred over traditional methods for its efficiency and suitability for automation. |
| Competent E. coli Cells | Host for transformation with assembled constructs to enable plasmid propagation and subsequent testing. | High-efficiency, chemically competent cells (e.g., DH5α) suitable for 96-well transformation. |
| Selective Growth Medium | Selects for transformed cells containing the correctly assembled plasmid with an antibiotic resistance marker. | LB broth or agar supplemented with the appropriate antibiotic (e.g., Carbenicillin 100 µg/mL). |
| 96-Well Plates (PCR & Deepwell) | Standardized labware for housing reactions and cultures in an automated workflow. | PCR plates for assembly; 2 mL deepwell plates for culture growth and plasmid preparation. |
Workflow and System Architecture Visualization
The following diagrams illustrate the logical workflow of the automated Build phase and the architecture of a integrated robotic platform.
Automated Build Phase Workflow
Modular Robotic Platform Architecture
In modern synthetic biology and drug development, the 'Test' phase is critical for transforming designed genetic constructs into reliable, empirical data. Automated analytics, screening, and data acquisition technologies have revolutionized this phase, enabling robotic platforms to execute autonomous Design-Build-Test-Learn (DBTL) cycles [31] [15]. This automation addresses the traditional bottleneck of manual data collection and analysis, facilitating rapid optimization of biological systems. By integrating advanced analytical instruments, machine learning algorithms, and high-throughput screening capabilities, these systems can conduct continuous, self-directed experiments. This article details the practical application of these technologies through specific experimental protocols and the underlying infrastructure that supports autonomous discovery.
Core Components of an Automated Test Platform
The transformation of a static robotic platform into a dynamic, autonomous system relies on the integration of specialized hardware and software components. These elements work in concert to execute experiments, gather high-dimensional data, and make intelligent decisions for subsequent iterations.
Hardware Architecture
The physical platform is composed of interconnected workstations, each serving a distinct function within the automated workflow. A representative setup includes [31]:
- Liquid Handling Robots: Both 8-channel (for individualized well treatment) and 96-channel (for full-plate operations) liquid handlers (e.g., CyBio FeliX) manage all reagent additions and inoculations.
- Microtiter Plate (MTP) Incubator: A shake incubator (e.g., Cytomat) maintains optimal growth conditions (e.g., 37°C, 1,000 rpm) for parallel microbial cultivations.
- Multi-mode Plate Reader: An instrument (e.g., PheraSTAR FSX) performs optical density (OD600) measurements to monitor growth and fluorescence detection to quantify target protein (e.g., GFP) expression.
- Robotic Arm: A gripper-equipped arm coordinates the transfer of MTPs between different workstations, ensuring a seamless workflow.
- Storage and Logistics: Integrated racks and refrigerated units store plates, tips, and reagents, while a de-lidder automates plate preparation for measurements.
Software and Data Framework
The software framework is the "brain" of the operation, enabling autonomy. Its key components are [31]:
- Experiment Manager: Central software (e.g., CyBio Composer) that orchestrates the physical workflow, scheduling tasks and device operations.
- Data Importer: A software component that automatically retrieves raw measurement data from platform devices (like the plate reader) and writes it into a centralized database.
- Optimizer: This is the core learning module. It accesses the database, analyzes the results, and runs a learning algorithm to select the next set of experimental conditions, balancing exploration of new parameter spaces and exploitation of known promising areas.
Experimental Protocol: Autonomous Optimization of Protein Expression
The following protocol details a specific experiment demonstrating an autonomous test-learn cycle for optimizing inducer concentration in a bacterial system, as established by Spannenkrebs et al. [31] [5].
Objective
To autonomously determine the optimal inducer concentration (e.g., IPTG or lactose) for maximizing the production of a recombinant protein (e.g., Green Fluorescent Protein, GFP) in Escherichia coli over four consecutive iterations of the test-learn cycle.
Materials and Reagents
Table 1: Research Reagent Solutions
| Item | Specification | Function in Protocol |
|---|---|---|
| Microtiter Plate (MTP) | 96-well, flat-bottom | Vessel for parallel microbial cultivation and analysis. |
| Bacterial Strain | E. coli or Bacillus subtilis with inducible GFP construct | Model system for evaluating protein expression. |
| Growth Media | Lysogeny Broth (LB) or other defined media | Supports microbial growth and protein production. |
| Inducer Solution | IPTG (Isopropyl β-d-1-thiogalactopyranoside) or Lactose | Triggers expression of the target protein from the inducible promoter. |
| Polysaccharide Feed | e.g., Starch or Glycogen | Source for controlled glucose release via enzyme addition. |
| Feed Enzyme | e.g., Amyloglucosidase | Hydrolyzes polysaccharide to control glucose release rate and growth. |
Detailed Step-by-Step Methodology
Day 1: Platform Preparation
- Reagent Setup: Aliquot sterile growth media, inducer stock solutions, and feed enzymes into designated refrigerated (4°C) positions on the robotic platform.
- Strain Inoculation: Manually pick a single colony of the expression strain to inoculate a pre-culture in a deep-well plate filled with media. Seal the plate and load it onto the platform's incubator.
Day 2: Autonomous Test-Learn Cycle Execution The following workflow runs autonomously for the duration of the experiment (e.g., 24-48 hours), repeating for multiple cycles.
Workflow Description:
- Dispense Media & Cells: The 96-channel liquid handler transfers a precise volume of fresh media from a reservoir to a new 96-well MTP. The 8-channel handler then inoculates each well with a standardized volume from the growing pre-culture.
- Apply Inducer/Feed Conditions: Based on the parameter set provided by the optimizer, the 8-channel liquid handler adds different concentrations of inducer (e.g., IPTG) and feed enzyme to the respective wells. The first iteration may use a pre-defined range or a random search.
- Incubate & Monitor: The robotic arm moves the MTP to the shake incubator. The plate remains there, with the system potentially scheduling brief interruptions for measurement.
- Measure OD600 & Fluorescence: The robotic arm retrieves the plate, transfers it to the plate reader, which measures the optical density (OD600) and fluorescence (ex/em for GFP) for every well. The plate is then returned to the incubator. This measurement is repeated at regular intervals (e.g., every 30-60 minutes) to generate time-resolved data.
- Data Importer: After the final time point, the raw measurement data is automatically extracted from the plate reader and structured into a database, including provenance (metadata linking data to experimental conditions).
- Optimizer: The learning algorithm (e.g., Bayesian Optimization, Random Forest) accesses the complete dataset. It fits a model that correlates the input parameters (inducer, feed) with the output (e.g., final GFP yield/OD). The model balances exploration (testing uncertain regions) and exploitation (refining known high-yield regions).
- Select Next Parameter Set: The optimizer selects the most informative set of conditions for the next iteration and writes them to the database.
- Cycle Control: The experiment manager checks if the predefined number of cycles (e.g., 4) is complete. If not, the cycle repeats from Step 2 using the new parameters. If complete, the platform halts and outputs the final results.
Data Acquisition and Analysis
- Primary Data: Time-course measurements of OD600 (biomass) and fluorescence (product).
- Key Metric: The platform typically aims to maximize a derived value, such as maximum fluorescence/OD600, which represents the specific productivity.
- Algorithm Comparison: The performance of active-learning algorithms (e.g., Bayesian Optimization) is often benchmarked against a baseline, such as a random search, to evaluate the efficiency of convergence to the optimum [31].
Performance Data and Technical Specifications
The quantitative output of the automated test phase is critical for evaluating its success and efficiency. The tables below summarize typical performance metrics and platform specifications.
Table 2: Autonomous DBTL Cycle Performance Metrics
| Metric | Baseline (Manual) | Automated Random Search | Automated ML-Driven | Notes |
|---|---|---|---|---|
| Cycle Time | Weeks | ~24-48 hours | ~24-48 hours | Time for one full DBTL iteration [31]. |
| Data Points per Cycle | 10s-100s | 100s-1000s | 100s-1000s | Enabled by microtiter plates and robotics [31]. |
| Optimization Efficiency | Low | Baseline | Up to 170x faster | ML can dramatically speed up convergence vs. manual methods [32]. |
| Parameter Space Exploration | Limited, sparse | Broad, uniform | Targeted, adaptive | ML algorithms focus on high-performance regions [31]. |
Table 3: Automated Platform Technical Specifications
| Component | Example Specification | Role in 'Test' Phase |
|---|---|---|
| Liquid Handler | 8- & 96-channel CyBio FeliX | Precistely dispenses cultures, inducers, and feeds. |
| Plate Reader | PheraSTAR FSX | Measures OD600 (growth) and fluorescence (GFP) in <0.2 sec/well [31]. |
| Incubator | Cytomat, 29 MTP capacity | Maintains constant temperature (37°C) and shaking (1000 rpm). |
| Software Scheduler | CyBio Composer Module | Manages complex, parallel task scheduling for all hardware. |
| Learning Algorithm | Bayesian Optimization | Selects next test parameters by balancing exploration/exploitation [31]. |
The integration of automated analytics, high-throughput screening, and machine learning within the 'Test' phase marks a paradigm shift in biological research and development. The detailed protocol and specifications provided here illustrate how autonomous robotic platforms can efficiently navigate complex experimental parameter spaces. This approach transforms the DBTL cycle from a sequential, human-dependent process into a continuous, self-improving system, significantly accelerating the pace of discovery and optimization for next-generation cell factories and therapeutic agents [31] [15]. By implementing these automated test-learn cycles, researchers can achieve unprecedented levels of reproducibility, scalability, and insight.
In modern, automated drug discovery and microbial engineering, the Design-Build-Test-Learn (DBTL) cycle has emerged as a foundational framework for accelerating research and development [15] [16]. While each stage is critical, the Learn phase represents the crucial pivot point where data is transformed into actionable knowledge. This phase involves the application of machine learning (ML) and statistical models to analyze experimental results from the "Test" stage, identify significant patterns, and generate predictive insights that directly inform the subsequent "Design" cycle [16]. In highly automated, robotic platforms, this process is streamlined to enable rapid, data-driven iteration, compressing development timelines that traditionally required years into months or even weeks. This document provides detailed application notes and protocols for effectively implementing the Learn phase within an automated DBTL research environment, with a specific focus on applications in pharmaceutical development and microbial strain engineering.
Core Workflow and Key Components of the Learn Phase
The Learn phase operates as the intellectual engine of the DBTL cycle. Its primary function is to close the loop by interpreting high-throughput experimental data to uncover the complex relationships between genetic designs (e.g., promoter strength, gene order, copy number) and observed phenotypic outcomes (e.g., compound titer, growth rate) [16]. The following diagram illustrates the integrated data flow and decision-making process within an automated Learn phase.
Figure 1. The automated Learn phase workflow. The process begins with raw data from high-throughput (HTP) screening, progresses through statistical and machine learning analysis, and concludes with the generation of new, informed design hypotheses for the next DBTL cycle.
Quantitative Impact of Iterative Learning
The iterative application of the Learn phase drives exponential improvements in microbial production and therapeutic candidate optimization. The following table summarizes performance gains from documented case studies applying sequential DBTL cycles.
Table 1. Quantitative Impact of Iterative DBTL Cycling on Production Metrics
| DBTL Cycle | Target Compound / Drug Candidate | Key Learned Factor | Outcome / Performance Gain |
|---|---|---|---|
| Cycle 1 | (2S)-Pinocembrin [16] | Vector copy number and CHI promoter strength had the strongest positive effects. | Identified key bottlenecks; established baseline production of 0.14 mg L⁻¹. |
| Cycle 2 | (2S)-Pinocembrin [16] | Application of learned constraints (high copy number, optimized gene order). | 500-fold increase in titer, achieving 88 mg L⁻¹. |
| Cycle 1 | Idiopathic Pulmonary Fibrosis Drug [22] [33] | AI-driven target discovery and compound screening. | Progressed from target discovery to Phase I trials in 18 months (vs. ~5 years traditionally). |
| Cycle 1 | CDK7 Inhibitor (Oncology) [22] | AI-guided molecular design and optimization. | Clinical candidate achieved after synthesizing only 136 compounds (vs. thousands typically). |
Detailed Experimental Protocols for the Learn Phase
Protocol 1: Data Processing and Normalization for HTP Screening Data
Objective: To clean, normalize, and structure raw analytical data from high-throughput screening (e.g., UPLC-MS/MS) for robust statistical analysis and machine learning.
Materials:
- Raw Data Files: Spectral data (e.g., .raw, .mzML) from mass spectrometry runs.
- Metadata File: A .csv file linking each sample well to its specific genetic design (e.g., promoter combination, gene order).
- Computing Environment: R or Python scripting environment with necessary packages.
Procedure:
- Data Extraction: Use custom R or Python scripts to automatically extract peak areas for the target product and key intermediates from all chromatograms. The pipeline described by Nature Communications Biology utilizes "custom-developed and open-source R scripts" for this purpose [16].
- Sample-Tracer Alignment: Map the extracted data to the experimental metadata using the unique sample IDs generated during the "Build" stage to ensure each measurement is correctly associated with its design parameters.
- Normalization: Apply internal standard normalization to correct for technical variation in sample preparation and instrument response. Calculate relative or absolute titers based on a standard curve run concurrently.
- Data Structuring: Compile the normalized titers and metadata into a structured data frame where each row represents a single biological construct and columns represent features (e.g., promoter strengths, gene order) and outcomes (e.g., final titer, intermediate accumulation).
Protocol 2: Statistical Analysis and Feature Ranking
Objective: To identify which design factors have a statistically significant impact on the production outcome.
Materials:
- Structured data frame from Protocol 1.
- Statistical software (e.g., R, JMP, Python with statsmodels).
Procedure:
- Exploratory Data Analysis (EDA): Generate summary statistics and visualizations (e.g., box plots of titer by promoter strength, correlation matrices) to understand data distribution and identify initial trends.
- Analysis of Variance (ANOVA): Perform ANOVA on the production data using the design factors (e.g., vector copy number, promoter strength for each gene, gene position) as independent variables. This quantitatively determines which factors explain a significant portion of the variance in the output.
- Example: In the pinocembrin case study, ANOVA revealed that "vector copy number had the strongest significant effect on pinocembrin levels (P value = 2.00 × 10⁻⁸), followed by a positive effect of the CHI promoter strength (P value = 1.07 × 10⁻⁷)" [16].
- Feature Ranking: Rank the design factors based on their calculated F-values or P-values from the ANOVA to prioritize the most influential parameters for the next design cycle.
Protocol 3: Machine Learning Model Training and Validation
Objective: To develop a predictive model that maps genetic design space to production performance, enabling in silico optimization.
Materials:
- Structured and normalized dataset.
- Machine learning library (e.g., scikit-learn in Python, caret in R).
Procedure:
- Data Splitting: Randomly split the dataset into a training set (e.g., 70-80%) and a hold-out test set (e.g., 20-30%).
- Model Selection and Training: Train one or more supervised learning models on the training set. Common choices include:
- Random Forest: Effective for capturing complex, non-linear interactions between design parameters without overfitting.
- Gradient Boosting Machines (XGBoost, LightGBM): Often provide high predictive accuracy.
- Support Vector Machines (SVMs): Useful for smaller datasets [15].
- Model Validation: Use k-fold cross-validation (e.g., k=5 or 10) on the training set to tune model hyperparameters and avoid overfitting.
- Final Evaluation: Apply the final tuned model to the hold-out test set to evaluate its predictive performance using metrics like R² (coefficient of determination) or Root Mean Squared Error (RMSE).
The Scientist's Toolkit: Essential Research Reagent Solutions
The following reagents, software, and analytical tools are critical for executing a robust Learn phase.
Table 2. Key Research Reagent Solutions for the Learn Phase
| Item | Function / Application | Example / Specification |
|---|---|---|
| RetroPath [16] | An automated computational tool for in silico design of novel biosynthetic pathways. | Used for the initial selection of enzyme candidates for a target compound. |
| Selenzyme [16] | A web-based enzyme selection tool that recommends the most suitable enzymes for a given reaction. | Accesses public databases to rank enzymes based on sequence, structure, and homology. |
| UPLC-MS/MS System | Provides quantitative, high-resolution data on target product and intermediate concentrations from microbial cultures. | Essential for generating the high-quality, quantitative data required for ML analysis. Protocol involves "fast ultra-performance liquid chromatography coupled to tandem mass spectrometry with high mass resolution" [16]. |
| R / Python Ecosystem | Open-source programming environments for data processing, statistical analysis, and machine learning. | Custom scripts are used for data extraction, normalization, and model building. |
| JBEI-ICE Repository [16] | A centralized database for tracking DNA parts, designs, and associated metadata. | Provides unique IDs for sample tracking, linking "Build" constructs to "Test" results. |
| Design of Experiments (DoE) | A statistical methodology for efficiently exploring a large combinatorial design space with a tractable number of experiments. | Enabled a 162:1 compression ratio, reducing 2592 possible pathway configurations to 16 representative constructs [16]. |
Generating and Implementing Design Hypotheses
The final, crucial output of the Learn phase is a set of validated, data-driven hypotheses that launch the next Design cycle. The following diagram outlines the logical process of translating model insights into new, optimized experimental designs.
Figure 2. The hypothesis generation and new design process. Insights from machine learning are formalized into concrete design rules, which are used to create and screen a virtual library of new constructs, resulting in a prioritized, focused list for the next "Build" phase.
Implementation Workflow:
- Formulate Design Rules: Translate the ranked features and ML model interpretations into concrete, testable design constraints. For example:
- Rule 1: Favor high-copy-number origin of replication (ColE1) for all constructs, as it was the strongest positive factor [16].
- Rule 2: Place the most critical enzyme gene (e.g., CHI) at the start of the operon to ensure strong expression.
- Rule 3: Remove non-influential factors from the design space to reduce complexity (e.g., ignore gene order if found to be non-significant).
- Generate & Screen Virtual Library: Using the predictive ML model, screen a large in silico library of potential genetic designs. The model predicts the performance of each virtual construct, allowing for the prioritization of those with the highest predicted titers.
- Output New Library for Build: The output is a finalized, statistically-guided library of new genetic constructs. This library is significantly more focused and enriched with high-potential designs than a naive, exploratory library, dramatically increasing the probability of success in the subsequent DBTL cycle.
Maximizing Efficiency and Overcoming Implementation Hurdles in Automated Workflows
The integration of robotic platforms into the Design-Build-Test-Learn (DBTL) cycle represents a paradigm shift in research and development, particularly in fields like synthetic biology and drug development. These systems promise to accelerate the pace of discovery by automating iterative experimental processes. However, the path to establishing a fully autonomous, closed-loop DBTL system is fraught with technical and operational challenges that can stifle productivity and diminish return on investment. This application note identifies the most critical bottlenecks encountered when deploying these sophisticated platforms and provides detailed protocols to guide researchers, scientists, and drug development professionals in overcoming them. The transition from human-guided experimentation to fully autonomous discovery requires seamless integration of machine learning, robotic hardware, and data infrastructure [34]. Even with advanced automation, the DBTL cycle often remains hampered by decision-making bottlenecks, where the speed of automated experiments outstrips the capacity to intelligently guide them [34]. The following sections provide a quantitative analysis of these bottlenecks, detailed experimental frameworks, and visualization tools to aid in the successful deployment of robotic platforms.
Quantitative Analysis of Deployment Bottlenecks
A successful deployment depends on anticipating key challenges. The table below summarizes the most common bottlenecks, their impact, and proven mitigation strategies, synthesized from real-world implementations.
Table 1: Common Bottlenecks in Robotic Platform Deployment for Automated DBTL Research
| Bottleneck Category | Specific Challenge | Quantitative Impact / Prevalence | Recommended Mitigation Strategy |
|---|---|---|---|
| Financial & Integration Costs | High upfront costs and integration complexity | System integration adds 10-30% to base robot cost ($10,000-$100,000+); full industrial robot implementation can reach $400,000 [35]. | Partner with vendors for pre-deployment scoping; factor in all costs for vision systems, safety components, and power upgrades [35]. |
| Workforce & Talent Gap | Shortage of AI and robotics expertise; employee resistance | ~40% of enterprises lack adequate internal AI expertise; workforce fears over job displacement create adoption friction [36] [37]. | Invest in upskilling programs (e.g., 1-2 day operator training); use low-code/no-code platforms to democratize operation [35] [36]. |
| Technical Integration | Legacy system incompatibility; data silos | Robotics in complex environments requires multidisciplinary expertise (data engineering, cloud, cybersecurity) that is often scarce [36] [38]. | Use vendor-agnostic control platforms (e.g., MujinOS) to avoid vendor lock-in; create centralized data lakes to break down silos [38] [36]. |
| Operational Flexibility | Limited adaptability for non-standard/unstructured tasks | Robots struggle with tasks involving irregular shapes, unpredictable materials, or nuanced decision-making [35]. | Implement platforms that combine advanced motion planning with real-time 2D/3D vision to handle variability [38]. |
| Cybersecurity & Data Management | Vulnerability of connected platforms to cyberattacks | In 2023, manufacturing was the top target for ransomware, with 19.5% of all incidents [35]. | Isolate robot networks, implement strict access permissions, and enforce consistent firmware updates [35]. |
| Physical Workflow Bottlenecks | DNA synthesis costs and speed limiting DBTL "Build" phase | DNA synthesis can account for over 80% of total project expense in high-throughput protein production [39]. | Adopt cost-slashing methods like DMX workflow, which reduces DNA construction cost by 5- to 8-fold [39]. |
Protocol for Establishing an Autonomous DBTL Cycle in a Robotic Platform
This protocol is adapted from successful implementations in microbial biosynthesis and protein engineering, detailing the steps to close the DBTL loop with minimal human intervention [31] [19].
Application and Principle
This protocol establishes a fully autonomous test-learn cycle to optimize biological systems, such as protein expression in bacteria. The core principle involves using a robotic platform to execute experiments, measure outputs, and then employ an active-learning algorithm to decide the parameters for the subsequent experimental iteration, thereby closing the loop without manual intervention [31].
Materials and Reagents
Table 2: Research Reagent Solutions for Autonomous DBTL Implementation
| Item Name | Function / Application in Protocol |
|---|---|
| Hamilton Microlab VANTAGE Platform | Core robotic liquid handling system for executing the "Build" and "Test" phases. Its modular deck allows for integration of off-deck hardware [19]. |
| Cytomat Shake Incubator (Thermo Fisher) | Provides temperature-controlled incubation with shaking for microbial cultivation during the "Test" phase [31]. |
| PheraSTAR FSX Plate Reader (BMG Labtech) | Measures optical density (OD600) and fluorescence (e.g., GFP) as key output metrics for the "Test" phase [31]. |
| Venus Software (Hamilton) | Programs and controls the VANTAGE platform's methods, including liquid handling and integration with external devices [19]. |
| 96-well Deep Well Plates | Standard labware for high-throughput microbial culturing and manipulation. |
| Competent Cells & Plasmid DNA | Biological inputs for the strain construction ("Build") phase of the DBTL cycle [19]. |
| Inducer Compounds (e.g., IPTG, Lactose) | Chemicals used to trigger protein expression; their concentration is a key variable for the autonomous system to optimize [31]. |
Experimental Workflow and Procedure
Step 1: Workflow Integration and User Interface Design
- Action: Program the robotic platform (e.g., using Hamilton VENUS software) to divide the workflow into discrete, modular steps. For a yeast transformation pipeline, this includes "Transformation set up and heat shock," "Washing," and "Plating" [19].
- Critical Parameter: Design a user interface with dialog boxes that allow customization of key parameters (e.g., DNA volume, heat shock time). This enables the platform to be adapted for various experimental needs without re-programming [19].
- Automation: Program the robotic arm to interact with off-deck hardware (e.g., plate sealers, thermal cyclers) to enable hands-free operation after initial deck setup [19].
Step 2: Automated Execution ("Build-Test")
- Action: The platform executes the pre-programmed physical workflow. For example, it performs a high-throughput transformation of S. cerevisiae in a 96-well format, followed by plating and incubation.
- Critical Parameter: Optimize liquid classes for each reagent, especially viscous ones like PEG, by adjusting aspiration/dispensing speeds and air gaps to ensure accuracy [19].
- Output: The output is a library of engineered strains. The platform achieves a throughput of ~400 transformations per day, a 10-fold increase over manual operations [19].
Step 3: Data Acquisition and Importer Function
- Action: Upon completion of the "Test" phase (e.g., cultivation), the platform's devices (e.g., plate reader) generate raw measurement data (e.g., fluorescence, OD600).
- Critical Parameter: An automated importer software component retrieves this data and writes it in a standardized format to a central database [31].
Step 4: Data Analysis and Optimizer Function (Autonomous "Learn")
- Action: An optimizer module (e.g., a machine learning algorithm) accesses the database, analyzes the results, and selects the next set of experimental conditions.
- Critical Parameter: The algorithm must balance exploration (testing new regions of the parameter space) and exploitation (refining conditions near the current best result) [31]. For optimizing a dual-factor system (e.g., inducer and feed), a supervised "low-N" regression model can be used to predict beneficial higher-order variants [34].
- Output: The optimizer writes the new experimental parameters (e.g., new inducer concentrations) back to the database, which are directly fed into the next "Build" cycle.
Step 5: Iteration
- Action: The platform automatically begins the next DBTL cycle using the parameters defined by the optimizer, closing the loop. This cycle continues for a pre-set number of iterations or until a performance target is met.
- Validation: In a landmark study, a similar autonomous platform achieved a ~16-fold increase in enzyme activity and a ~90-fold shift in substrate preference in just four weeks and four iterative cycles [34].
Visualization of the Autonomous DBTL Workflow
The following diagram illustrates the integrated software and hardware components that enable a fully autonomous DBTL cycle.
Discussion and Concluding Remarks
Deploying robotic platforms for autonomous DBTL research is a multi-faceted challenge that extends beyond the mere purchase of hardware. The most significant bottlenecks are not always technical but often involve financial planning, workforce development, and the creation of a seamless data architecture. As demonstrated in the protocol, the integration of an active-learning software framework is the crucial element that transforms a static automated platform into a dynamic, self-optimizing system [31].
The future of this field lies in the development of generalized, AI-powered platforms that require only a starting protein sequence or fitness metric to begin autonomous discovery, effectively creating an "AI scientist" [34]. Success hinges on a strategic approach that addresses the high upfront costs, invests in operator training, prioritizes flexible and integrable systems, and establishes robust data management practices from the outset. By proactively managing these bottlenecks, research organizations can fully harness the power of robotic automation to accelerate the DBTL cycle and drive innovation.
For research institutions operating automated robotic platforms for Design-Build-Test-Learn (DBTL) research, unplanned equipment downtime is a critical bottleneck. It disrupts continuous experimentation, compromises data integrity, and significantly increases the cost and timeline of drug development campaigns. AI-powered predictive maintenance emerges as a strategic imperative, transforming maintenance operations from a reactive to a proactive, data-driven function. By leveraging machine learning and real-time data analytics, these systems can predict equipment failures before they occur, enabling maintenance to be scheduled without interrupting critical research workflows. This approach is foundational to achieving true real-time system optimization, ensuring that robotic research platforms operate at peak efficiency and reliability [40] [41].
The integration of predictive maintenance within automated biofoundries, such as the Illinois Biological Foundry for Advanced Biomanufacturing (iBioFAB), has demonstrated profound impacts. These systems move beyond simple fault detection to prescriptive analytics, recommending specific actions to prevent failures and autonomously adjusting operational parameters. This capability is crucial for maintaining the integrity of long-term, automated experiments in synthetic biology and enzyme engineering, where consistent equipment performance is directly tied to experimental success [3].
Quantitative Impact of AI-Powered Predictive Maintenance
The adoption of AI-driven predictive maintenance strategies yields substantial quantitative benefits across operational and financial metrics. The data, consolidated from industry reports and case studies, demonstrates its transformative potential.
Table 1: Financial and Operational Benefits of AI-Powered Predictive Maintenance
| Metric | Impact Range | Source / Context |
|---|---|---|
| Reduction in Maintenance Costs | 25% - 50% | [42] [43] |
| Reduction in Unplanned Downtime | 35% - 70% | [40] [42] [43] |
| Increase in Machine Life | 20% - 40% | [40] |
| Failure Prediction Accuracy | Up to 90% | [42] |
| Return on Investment (ROI) | 10x - 15x within 9 months | [41] |
| Reduction in False Alarms | Up to 90% | [41] |
Table 2: Market Growth and High-Cost Downtime Examples
| Metric | Value | Source / Context |
|---|---|---|
| Global Predictive Maintenance Market (2024) | $10.93 - $14.09 billion | [42] [41] |
| Projected Market (2030-2032) | $63.64 - $70.73 billion | [42] [41] |
| Cost of Unplanned Downtime (Semiconductor Manufacturing) | >$1 million per hour | [42] |
| Median Cost of Unplanned Downtime (Across Industries) | >$125,000 per hour | [42] |
AI Technology Stack for Predictive Maintenance
The effectiveness of predictive maintenance hinges on a integrated technology stack that transforms raw data into actionable insights.
Core Technologies
- Internet of Things (IoT) Sensors: These devices are the foundational data-gathering layer. They continuously monitor equipment conditions, tracking metrics such as temperature, vibration, pressure, and power consumption. Modern facilities deploy thousands of these sensors to create a comprehensive monitoring network [40] [42].
- Machine Learning Algorithms: ML models analyze historical and real-time data to predict failures.
- Supervised Learning: Used with labeled datasets to learn the relationship between sensor inputs (e.g., vibration patterns) and equipment status (e.g., normal or failing) [40].
- Unsupervised Learning: Identifies hidden patterns and anomalies in unlabeled data, useful for detecting novel failure modes [40].
- Reinforcement Learning: Learns optimal maintenance policies through interaction with the operational environment, continuously improving scheduling and response actions [40].
- Deep Learning and Neural Networks: Models like Convolutional Neural Networks (CNNs) and Recurrent Neural Networks (RNNs) excel at recognizing complex patterns in time-series sensor data, enabling the detection of subtle anomalies indicative of impending failures [40] [42].
- Big Data Analytics: Platforms like Apache Spark process the vast volumes of data generated by IoT sensors, performing advanced analytics like predictive modeling and statistical analysis [40].
- Edge Computing: This paradigm involves processing data locally on or near the equipment, which significantly reduces latency for critical decisions. This is ideal for high-speed manufacturing or research processes where delays can cause significant production or experimental loss [42].
Emerging Trends: Explainable and Prescriptive AI
The future of predictive maintenance lies in moving beyond "black box" predictions.
- Explainable AI (XAI): Industrial operators require transparency. XAI provides clear reasoning behind alerts, tracing recommendations back to specific data points and historical patterns. This builds trust and allows operators to verify the AI's logic, leading to a reported 90% reduction in alert fatigue [41].
- Prescriptive AI: This advanced form doesn't just predict failures; it recommends specific corrective actions, generates work orders, and can even autonomously adjust operating parameters to prevent failures. It combines real-time data with maintenance records and OEM specifications to provide expert-level guidance [41].
Application Notes for Robotic DBTL Research Platforms
In the context of an automated DBTL platform for research, predictive maintenance is critical for instruments like robotic liquid handlers, incubators, plate readers, and bioreactors. A failure in any component can invalidate an entire experimental cycle.
Protocol: Implementing a Predictive Maintenance System for a Robotic Liquid Handler
Objective: To proactively maintain a robotic liquid handler by monitoring key performance indicators to prevent failures that would compromise assay results and halt automated workflows.
Materials:
- Vibration sensors (e.g., piezoelectric accelerometers)
- Temperature and humidity sensors
- Data acquisition system (e.g., National Instruments DAQ)
- Edge computing device (e.g., Intel NUC)
- Predictive maintenance software platform (e.g., UptimeAI, or custom Python with scikit-learn/TensorFlow libraries)
Methodology:
- System Assessment & Sensor Deployment:
- Identify critical components: robotic arm axes, pipetting head, syringe pumps, and plate grippers.
- Install vibration sensors on the base of the robotic arm and the pipetting head to monitor for unusual oscillations or deviations from baseline motion profiles.
- Install temperature sensors near the electronic drive motors and the syringe pumps to detect overheating.
Data Collection and Integration:
- Establish a baseline by collecting sensor data (vibration, temperature) and operational metadata (throughput, accuracy) over a period of known normal operation (e.g., 2-4 weeks).
- Ingest maintenance logs to label historical data with known failure events (e.g., "axis motor replaced," "pipette seal leak").
- Integrate sensor data streams with the laboratory information management system (LIMS) to correlate equipment state with experimental batches.
Model Development and Training:
- Feature Engineering: Extract features from raw sensor data, such as statistical features (mean, root-mean-square, kurtosis of vibration), frequency-domain features from Fast Fourier Transform (FFT), and time-series features.
- Algorithm Selection: Train a supervised learning model (e.g., Gradient Boosting or LSTM network) using the labeled historical data. The model will learn to classify equipment health (e.g., "Normal," "Degrading," "Imminent Failure") or predict the Remaining Useful Life (RUL) of components.
- Model Validation: Validate model performance using a hold-out dataset, targeting >85% accuracy in predicting known failure events.
Deployment and Real-Time Monitoring:
- Deploy the trained model on the edge device for low-latency inference.
- The system continuously monitors sensor data. If the model predicts a failure probability exceeding a set threshold (e.g., 90%), it triggers an alert.
- The prescriptive system automatically generates a work order in the CMMS, orders necessary spare parts, and recommends scheduling maintenance during the next planned instrument downtime.
Continuous Learning:
- Implement a feedback loop where the outcomes of maintenance actions (e.g., "true failure" or "false positive") are fed back into the model to retrain and improve its accuracy over time.
Visualization of Workflows
The following diagram illustrates the integrated workflow of an AI-powered predictive maintenance system within an automated DBTL cycle.
AI-PDM in DBTL Cycle
The next diagram details the technical workflow of the predictive maintenance system itself, from data acquisition to actionable insights.
AI-PDM Technical Workflow
The Scientist's Toolkit: Research Reagent Solutions & Essential Materials
Implementing a robust predictive maintenance program requires both hardware and software components. The following table details key solutions and their functions in a research context.
Table 3: Essential Resources for AI-Predictive Maintenance Implementation
| Category | Specific Tool / Technology | Function in Predictive Maintenance |
|---|---|---|
| Sensors & Hardware | Vibration Monitoring Sensors | Detects imbalances, misalignments, and bearing wear in robotic arms, centrifuges, and shakers [42]. |
| Temperature & Humidity Sensors | Monifies environmental conditions in incubators, bioreactors, and storage units to prevent experimental drift [42]. | |
| Acoustic & Ultrasonic Sensors | Identifies cavitation in pumps, leaks in valves, and abnormal friction sounds [42]. | |
| Data & Analytics Platforms | Predictive Maintenance Software (e.g., UptimeAI) | Provides a centralized platform for data aggregation, ML model execution, and prescriptive recommendations [41]. |
| Cloud/Edge Computing Infrastructure | Enables scalable data storage and real-time analytics at the source for low-latency decision-making [42]. | |
| Modeling & Execution | Machine Learning Libraries (e.g., Scikit-learn, TensorFlow, PyTorch) | Provides algorithms for building custom predictive models for specific laboratory equipment [40]. |
| Laboratory Information Management System (LIMS) | Integrates equipment performance data with experimental metadata for contextualized analysis [3]. |
In the context of robotic platforms and automated Design-Build-Test-Learn (DBTL) research, the demand for speed and scalability is met with a non-negotiable requirement: data integrity [44]. High-throughput systems generate enormous volumes of data, and ensuring its accuracy, consistency, and reliability is paramount for drawing valid scientific conclusions. Data integrity is not merely a technical concern; it is the foundation upon which trustworthy automation is built. In environments where samples are handled by robotic systems and data flows from integrated instruments, the principles of data integrity ensure that every action is traceable, timestamped, and auditable, thus transforming a static robotic platform into a dynamic, self-optimizing research tool [5] [44].
Core Principles of Data Integrity
Data integrity means that services remain accessible to users and that the data is accurate and consistent throughout its lifetime [45]. From a user's perspective, data loss, corruption, and extended unavailability are typically indistinguishable; therefore, data integrity applies to all types of data across all services [45]. In regulated life sciences, this is often formalized by the ALCOA+ principles, ensuring data is Attributable, Legible, Contemporaneous, Original, Accurate, and more [44].
For automated, high-throughput research, these principles translate into specific requirements:
- Accuracy and Completeness: Data must be correct and must capture the full context of the automated experiment, including all metadata.
- Consistency Across Systems: In highly connected labs, data must remain consistent across various systems like LIMS, automated stores, and analytical instruments [44].
- Timeliness and Availability: Data must be available for analysis and decision-making within the timeframes required by the DBTL cycle. As evidenced in cloud applications, even 24 hours of unavailability can be considered "too long" [45].
- Traceability and Auditability: Every action—a robotic movement, a sample scan, a data transfer—must be captured in a way that allows for full traceability and easy auditing [44].
Best Practices and Strategies
Implementing a system of checks and balances is crucial to prevent an application's data from degrading before its users' eyes [45]. The following best practices are essential for managing high-throughput data.
Table 1: Essential Data Integrity Best Practices for High-Throughput Systems
| Practice | Description | Key Implementation Considerations |
|---|---|---|
| Data Validation & Verification [46] | Checks for accuracy and adherence to predefined rules at entry; cross-referencing with reliable sources. | Implement range checks, format checks, and cross-field validations. Crucial after automated data collection steps. |
| Access Control [46] | Restricting data access to authorized personnel based on roles (RBAC). | Reduces risk of unauthorized access and manipulation. Integrate with lab user management systems. |
| Data Encryption [46] | Protecting sensitive data both during transmission (SSL/TLS) and at rest (disk/database encryption). | Ensures data confidentiality in networked environments where data moves between instruments, storage, and analysis servers. |
| Regular Backups & Recovery [45] [46] | Performing regular backups and having a robust plan to restore data to a consistent state. | Distinguish between backups (for disaster recovery) and archives (for long-term compliance). Test recovery procedures. |
| Audit Trails & Logs [46] | Maintaining detailed, immutable logs of data changes, access activities, and system events. | Automated logging of all robotic actions and data transactions is non-negotiable for audit readiness [44]. |
| Data Versioning [46] | Tracking changes to data over time, allowing identification of discrepancies and reversion to prior states. | Enables reproducibility and tracks the evolution of experimental results through multiple DBTL cycles. |
| Error Handling [46] | Implementing procedures to promptly identify, log, and rectify data inconsistencies or errors. | Automated alerts for process failures or data anomalies allow for rapid intervention. |
A critical strategic choice is between optimizing for uptime versus data integrity. While an hour of downtime may be unacceptable, even a small amount of data corruption can be catastrophic [45]. The secret to superior data integrity in high-throughput environments is proactive detection coupled with rapid repair and recovery [45].
Experimental Protocols for Data Integrity
Protocol: Implementing a High-Throughput Data Analysis and Validation Pipeline
This protocol is adapted from methodologies used in high-throughput qPCR analysis and is applicable to various data streams generated by robotic platforms [47].
1. Objective: To establish a standardized, automated workflow for the analysis, quality control, and validation of high-throughput experimental data, ensuring its integrity before it enters the broader data ecosystem.
2. Experimental Workflow:
3. Materials and Reagents: Table 2: Research Reagent Solutions for High-Throughput Data Management
| Item | Function |
|---|---|
| Robotic Platform with Integrated Sensors | Executes experimental workflows; captures primary data (e.g., optical measurements, volumes) and metadata (timestamps, locations). |
| Centralized Database | Serves as a single source of truth; stores raw and processed data with structured schemas to ensure consistency and avoid orphaned data [44]. |
| Data Processing Scripts (e.g., Python/R) | Perform automated calculations, data transformations, and crucially, apply quality control metrics (e.g., PCR efficiency, dynamic range, Cq values) [47]. |
| Visualization Dashboard (e.g., R Shiny, Tableau) | Enables rapid evaluation of overall experimental success by visualizing key quality parameters for multiple targets or conditions in a single graph [47]. |
4. Procedure:
1. Automated Data Ingestion: Upon completion of a run on the robotic platform, trigger an automated importer script. This script retrieves raw measurement data from the platform's devices and writes it directly to a centralized database, ensuring data is original and contemporaneous [5].
2. Quality Metric Calculation: Execute automated analysis scripts on the raw data. For each data target (e.g., a specific amplicon in qPCR, a specific sensor readout), calculate key quality metrics. Based on the MIQE guidelines, these should include [47]:
- Efficiency: A measure of the robustness of the signal response.
- Dynamic Range & Linearity: The range over which the response is linear (R² ≥ 0.98).
- Precision: The reproducibility of replicate measurements (Cq variation ≤ 1).
- Signal Consistency: Ensuring fluorescence or other signal data is consistent and not jagged.
- Specificity: The difference (ΔCq) between positive signals and negative controls should be greater than 3.
3. Data Quality Scoring: Assign a composite quality score (e.g., on a scale of 1-5) for each data target based on the calculated metrics. A score of 4 or 5 represents high-quality, reliable data [47].
4. Visualization and Triage: Use a "dots in boxes" visualization method. Plot one key metric (e.g., Efficiency) against another (e.g., ΔCq). Data points falling within a pre-defined "high-quality" box and with a high quality score are automatically integrated into the data lake for the "Learn" phase. Others are flagged for review [47].
Protocol: Establishing a Closed-Loop DBTL Cycle for Autonomous Optimization
This protocol details the steps to move from a static automated platform to a dynamic system that uses data integrity to fuel autonomous learning [5].
1. Objective: To create a closed-loop system where data from the "Test" phase is automatically analyzed to inform and optimize the parameters for the next "Design-Build" cycle, minimizing human intervention.
2. Experimental Workflow:
3. Materials and Reagents:
- All items from Protocol 4.1.
- Optimizer Software Component: An algorithm (e.g., based on machine learning or direct search) that selects the next set of experimental parameters based on the analyzed results, balancing exploration and exploitation [5].
4. Procedure: 1. Execute Initial Cycle: The robotic platform executes a designed experiment (e.g., testing different inducer concentrations for a bacterial system). 2. Analyze and Learn: Follow Protocol 4.1 to ensure data integrity and analyze outcomes. The system then fits a model (e.g., a regression model) to the relationship between input parameters and output results. 3. Autonomous Optimization: The optimizer component uses this model to predict the parameter set that will yield an improved outcome (e.g., higher GFP fluorescence). It selects the next measurement points autonomously [5]. 4. Close the Loop: The newly optimized parameters are automatically fed back to the "Design" phase, and the platform executes the next iteration of the experiment. 5. Termination: The cycle continues autonomously until a predefined success criterion is met (e.g., fluorescence intensity reaches a target threshold, or the model converges).
The Scientist's Toolkit
Table 3: Essential Research Reagent Solutions for Automated High-Throughput Research
| Category | Item | Function |
|---|---|---|
| Platform & Hardware | Robotic Liquid Handler | Precisely dispenses nanoliter to milliliter volumes of samples and reagents in microplates. |
| Automated Microplate Reader | Measures optical signals (absorbance, fluorescence, luminescence) from samples in microplates. | |
| Automated Storage System | Provides temperature-controlled storage for samples and reagents with robotic retrieval. | |
| Software & Data Management | Laboratory Information Management System (LIMS) | Tracks samples, workflows, and associated data, providing a central operational database. |
| Data Integration & Orchestration Platform | Connects disparate instruments and software, ensuring every data transaction is validated and recorded [44]. | |
| Electronic Lab Notebook (ELN) | Captures experimental context, protocols, and observations, linking them to raw data. | |
| Key Reagents | Reporter Assays (e.g., GFP, Luciferase) | Provide a quantifiable readout of biological activity in high-throughput screens. |
| Viability/Cytotoxicity Assays | Measure cell health and number in proliferation or toxicity studies. | |
| High-Sensitivity Assay Kits | Optimized chemistries for detecting low-abundance targets in small volumes. |
Ensuring data integrity in high-throughput, automated research is a multifaceted challenge that requires a holistic strategy. By integrating the core principles of ALCOA into the very architecture of the system—from robotic hardware to data orchestration software—labs can build a foundation of trust in their data [44]. The implementation of robust best practices, such as automated validation, comprehensive audit trails, and disciplined backup/recovery plans, protects against loss and corruption [46]. Furthermore, by adopting standardized protocols for data analysis and, crucially, closing the DBTL loop with autonomous optimization, researchers can transform their robotic platforms from mere tools of efficiency into dynamic engines of discovery. This approach ensures that as data volumes and velocities continue to climb, data integrity remains the constant that enables scientific rigor and reliable innovation.
Quantitative Analysis of DBTL Cycle Performance
The application of an automated Design-Build-Test-Learn (DBTL) pipeline for microbial production of fine chemicals demonstrates significant efficiency improvements. The table below summarizes key quantitative outcomes from a study optimizing (2S)-pinocembrin production in E. coli [16].
Table 1: Performance Metrics from Automated DBTL Implementation
| DBTL Cycle | Number of Constructs | Pinocembrin Titer Range (mg L⁻¹) | Key Significant Factors Identified | Compression Ratio |
|---|---|---|---|---|
| Cycle 1 | 16 | 0.002 – 0.14 | Vector copy number (P = 2.00 × 10⁻⁸), CHI promoter strength (P = 1.07 × 10⁻⁷) | 162:1 |
| Cycle 2 | 12 | 88 (maximum) | Gene order, specific promoter combinations | Not specified |
The data demonstrates a 500-fold improvement in production titer after two DBTL cycles, achieving a final competitive titer of 88 mg L⁻¹ [16]. The use of statistical design of experiments (DoE) enabled a compression ratio of 162:1, allowing the investigation of a theoretical design space of 2,592 combinations with only 16 constructed variants [16].
Experimental Protocol: Automated DBTL for Metabolic Pathway Engineering
This protocol details the application of an automated DBTL pipeline for optimizing biosynthetic pathways, as demonstrated for flavonoid production in E. coli [16].
Design Phase
- Pathway & Enzyme Selection: Utilize in silico tools like RetroPath [16] and Selenzyme [16] for automated biochemical pathway design and enzyme selection based on the target compound.
- DNA Part Design: Employ software such as PartsGenie to design reusable DNA parts, including optimization of ribosome-binding sites (RBS) and codon usage for coding regions [16].
- Combinatorial Library Design: Define parameters (e.g., vector backbone copy number, promoter strength variants, gene order permutations) to create a large combinatorial library of pathway designs [16].
- Library Reduction: Apply statistical Design of Experiments (DoE) methods, such as orthogonal arrays combined with a Latin square, to reduce the library to a tractable number of representative constructs for laboratory testing [16].
- Output: The phase concludes with automated generation of assembly recipes and robotics worklists, with all designs deposited in a centralized repository like JBEI-ICE for sample tracking [16].
Build Phase
- DNA Synthesis: Initiate construction via commercial DNA synthesis of the designed parts [16].
- Automated Assembly: Use robotic platforms to perform pathway assembly via methods such as ligase cycling reaction (LCR), based on the pre-generated worklists [16].
- Quality Control (QC): Execute high-throughput automated plasmid purification from transformed E. coli, followed by quality check via restriction digest and analysis by capillary electrophoresis. Verify all constructs by sequencing [16].
Test Phase
- Cultivation: Grow candidate strains in 96-deepwell plates using automated liquid handling systems with standardized growth and induction protocols [16].
- Metabolite Analysis: Employ automated extraction of target compounds from cultures, followed by quantitative analysis using fast ultra-performance liquid chromatography coupled to tandem mass spectrometry (UPLC-MS/MS) [16].
- Data Processing: Use custom-developed scripts (e.g., in R) for automated data extraction and processing from analytical instruments [16].
Learn Phase
- Statistical Analysis: Identify relationships between production titers and design factors (e.g., vector copy number, promoter strength) using statistical methods to determine significant effects with P-values [16].
- Machine Learning: Apply machine learning models to analyze the data and inform the design constraints for the subsequent DBTL cycle [16].
- Redesign: Use insights gained to refine and focus the design space for the next iteration, prioritizing the most impactful genetic factors [16].
Workflow Diagram: Automated DBTL Pipeline
The following diagram illustrates the integrated and iterative nature of the automated DBTL pipeline for engineering biology [16].
Research Reagent Solutions for Automated DBTL
Table 2: Key Research Reagents and Materials for DBTL Implementation
| Reagent/Material | Function/Description | Example/Source |
|---|---|---|
| RetroPath [16] | Computational tool for automated in silico biochemical pathway design from a target compound. | Web-based platform. |
| Selenzyme [16] | Automated enzyme selection tool for a given biochemical reaction. | http://selenzyme.synbiochem.co.uk |
| PartsGenie [16] | Software for designing reusable DNA parts, optimizing RBS, and coding sequences. | https://parts.synbiochem.co.uk |
| JBEI-ICE Repository [16] | Centralized database for storing DNA part designs, plasmid assemblies, and associated metadata with unique IDs for sample tracking. | Open-source repository. |
| Ligase Cycling Reaction (LCR) [16] | A DNA assembly method amenable to automation on robotic platforms for constructing pathway variants. | Protocol available in Supplementary Data of [16]. |
| UPLC-MS/MS [16] | Analytical platform for quantitative, high-throughput screening of target products and pathway intermediates from microbial cultures. | Commercially available systems. |
Cross-Training Framework Diagram
Effective cross-training integrates diverse skills. The following diagram outlines the core competency areas and their integration within a cross-training framework for scientists in automated DBTL environments, synthesized from current programs [48] [49] [50].
Within modern research institutions, the adoption of robotic platforms and automated workflows within the Design-Build-Test-Learn (DBTL) cycle is no longer a luxury but a necessity for maintaining competitive advantage. However, securing funding for such capital-intensive investments requires a compelling, data-driven justification. This document provides a standardized framework for researchers, scientists, and drug development professionals to quantify the economic impact of lab automation, moving beyond qualitative benefits to a rigorous financial analysis. By applying this protocol, research teams can build a robust business case that clearly articulates the return on investment (ROI) for automation projects, ensuring resources are allocated to initiatives that deliver maximum scientific and economic value.
Theoretical Framework: Core Principles of Automation ROI
Return on Investment (ROI) for lab automation is a performance measure used to evaluate the efficiency of an investment or to compare the efficiencies of several different investments. In the context of automated robotic platforms, ROI calculates the financial and operational benefits gained relative to the total costs incurred [51] [52].
The core financial formula for calculating automation ROI is expressed as a percentage:
Automation ROI (%) = ((Benefits from Automation - Automation Costs) / Automation Costs) × 100 [51]
A positive ROI indicates that the benefits outweigh the costs, justifying the investment. The calculation must account for both tangible factors, such as time savings and consumables reduction, and intangible benefits, such as improved data quality and enhanced employee satisfaction.
Key Factors Influencing Automation ROI
Several critical factors directly impact the ROI calculation for lab automation [51] [53]:
- Initial Investment: Includes costs for robotic hardware, software licensing, system integration, and initial training.
- Test Case Selection: Automating stable, high-frequency, and high-impact experimental protocols maximizes early returns.
- Maintenance Effort: Regular calibration, software updates, and hardware servicing represent ongoing costs that must be factored in.
- Execution Speed and Frequency: The value of automation compounds with increased throughput and the ability to run experiments outside of standard working hours.
- Team Skill and Productivity: A skilled team can develop more reliable and efficient automated methods, leading to higher ROI.
- Data Quality and Reproducibility: Reduction in human error leads to higher-quality, more reproducible data, reducing the cost of repeated experiments.
Experimental Protocol: A Step-by-Step Guide to Calculating ROI
This protocol provides a detailed methodology for assessing the economic impact of a lab automation system over a defined period (e.g., one year).
Step 1: Calculate Total Savings and Benefits
The first step quantifies the financial benefits gained from automation by comparing the new state to the previous manual workflow.
1.1 Quantify Time Savings: Track the time required to execute specific experimental protocols (e.g., PCR setup, cell culture passaging, compound screening) both manually and via the automated system. Savings are calculated as [51] [52]:
Savings = (Time for manual protocol - Time for automated protocol) × Number of protocols × Number of protocol runs over the assessment period
1.2 Calculate Labor Cost Savings: Convert time savings into financial terms using fully burdened labor rates for the researchers involved.
1.3 Quantify Material Savings: Document reductions in reagent or consumable usage achieved through automated liquid handling, which minimizes dead volumes and pipetting errors.
1.4 Assess Error Reduction Cost Avoidance: Estimate the costs avoided by reducing repetitive strain injuries, sample contamination, or data integrity issues attributable to manual processes.
Step 2: Calculate Total Investment
This step involves a comprehensive accounting of all costs associated with the automation project.
2.1 Initial Setup Costs: This includes the purchase price of robotic equipment, sensors, and control computers, as well as costs for system installation, integration, and facility modifications.
2.2 Development Costs: Calculate the person-hours required for developing, programming, and validating the automated methods and protocols.
2.3 Ongoing Costs: Account for annual maintenance contracts, software licensing fees, and dedicated consumables (e.g., specific tip sizes, labware). A critical component is the Maintenance Cost [51] [52]:
Maintenance Cost = Maintenance time per protocol update × % of protocols requiring updates per run × Number of protocols × Number of protocol runs
Step 3: Compute ROI and Payback Period
With savings and investment data collected, finalize the financial metrics.
3.1 Apply the ROI Formula: Input the total savings (benefits) and total costs (investment) into the core ROI formula to determine the return percentage.
3.2 Calculate Payback Period: Determine the time required for the cumulative savings to recoup the initial investment.
Payback Period (years) = Total Initial Investment / Annual Net Savings
3.3 Perform Sensitivity Analysis: Model how changes in key assumptions (e.g., protocol run frequency, labor rates) impact the ROI to understand the investment's risk profile.
Data Presentation and Analysis
Table 1: Comparative analysis of a high-throughput screening assay performed manually and via an automated robotic platform over one year.
| Metric | Manual Process | Automated Process | Difference (Absolute) | Difference (Relative) |
|---|---|---|---|---|
| Time per Protocol (hours) | 8.0 | 2.5 | 5.5 hours | 68.8% reduction |
| Protocols per Year | 100 | 350 | 250 | 250% increase |
| Total Annual Time (hours) | 800 | 875 | -75 | N/A |
| Error Rate | 2.5% | 0.5% | 2.0% | 80% reduction |
| Reagent Cost per Protocol | $150 | $145 | $5 | 3.3% reduction |
| Total Annual Reagent Cost | $15,000 | $50,750 | -$35,750 | N/A |
ROI Calculation Breakdown
Table 2: Detailed one-year ROI calculation based on the data from Table 1. Assumes a fully burdened labor rate of $75/hour.
| Category | Calculation | Value |
|---|---|---|
| Total Savings (Benefits) | ||
| Labor Savings | (5.5 hours/protocol * 100 manual protocols) * $75/hour | $41,250 |
| Error Cost Avoidance | (2.0% error rate * 100 protocols * $500/error) | $1,000 |
| Total Investment (Costs) | ||
| Initial Hardware/Software | Robotic arm, liquid handler, integration | $250,000 |
| Development & Validation | 200 person-hours * $75/hour | $15,000 |
| Annual Maintenance | 10% of initial investment | $25,000 |
| Net Benefit | Total Savings - Total Investment | ($247,750) |
| ROI | (($42,250 - $290,000) / $290,000) * 100 | -85.4% |
Note: The first-year ROI is negative due to high initial capital investment. ROI typically becomes positive in subsequent years as initial costs are amortized and savings accumulate.
Visualization of the ROI Calculation Workflow
ROI Calculation Workflow
The Scientist's Toolkit: Essential Reagents and Materials for Automated Workflows
Transitioning to automated platforms often requires specialized consumables and reagents optimized for robotic handling.
Table 3: Key research reagent solutions for automated DBTL platforms.
| Item | Function in Automated Workflow |
|---|---|
| Barcoded Labware | Microplates, tube racks, and reservoir with machine-readable codes for automated tracking and inventory management by the robotic system. |
| Liquid Handling Reagents | Pre-packaged, standardized reagents in sealed, robotic-accessible reservoirs to minimize manual intervention and ensure pipetting accuracy. |
| High-Throughput Screening Assay Kits | Assays specifically validated for miniaturized formats (e.g., 1536-well plates) and compatible with automated readers and detectors. |
| System Calibration Standards | Fluorescent, luminescent, or colored solutions used for periodic calibration of liquid handlers, detectors, and robotic arms to ensure data integrity. |
| Automation-Compatible Enzymes & Buffers | Reaction components formulated for stability at room temperature and low viscosity to support precise, non-contact dispensing. |
Interpretation of Results and Common Pitfalls
Interpreting ROI calculations requires a long-term perspective. A negative ROI in the first year is common and expected due to high initial capital expenditure, as shown in the data analysis. Positive ROI is typically realized in subsequent years once the system is fully operational and the initial investment is absorbed [53]. Key considerations for accurate interpretation include:
- Time Horizon: ROI calculations must project savings over a 3-5 year period to accurately reflect the investment's value.
- Intangible Benefits: Factor in strategic advantages such as increased lab capacity, ability to attract funding, and publication of higher-impact science, which are not directly captured in financial formulas.
- Avoiding Common Gaps: Common mistakes that skew ROI calculations include ignoring ongoing maintenance costs, overestimating the reusability of methods without modification, and failing to account for the training time required for personnel [51] [52].
By systematically applying this framework, research organizations can make informed, defensible decisions regarding investments in lab automation, ensuring that robotic platforms within the DBTL cycle deliver not only scientific innovation but also demonstrable economic value.
Benchmarking Success: Validating Performance and Comparing Robotic Platform Efficacy
The integration of robotic platforms into scientific research has revolutionized the pace and potential of biological discovery. Automated Design-Build-Test-Learn (DBTL) cycles are at the heart of this transformation, enabling high-throughput, reproducible experimentation in fields like protein engineering, metabolic engineering, and drug development [3] [19]. However, the full value of these advanced systems can only be realized through rigorous performance management. Key Performance Indicators (KPIs) serve as the critical gauges for these automated workflows, providing the data-driven insights necessary to evaluate efficiency, guide strategic improvements, and demonstrate return on investment [54]. This application note details the essential KPIs and methodologies for optimizing automated DBTL cycles within robotic research platforms.
Quantitative KPI Framework for Automated DBTL Cycles
Effective management of automated DBTL cycles requires tracking KPIs across different dimensions of the workflow. The following tables categorize and define these key metrics for easy implementation and monitoring.
Table 1: Core Performance and Efficiency KPIs for Automated DBTL Cycles
| KPI Category | Specific KPI | Calculation Formula | Target Benchmark |
|---|---|---|---|
| Cycle Velocity | Test Execution Time [54] [55] | End Time - Start Time | Complete regression suite < 30 minutes [55] |
| In-Sprint Automation Rate [54] | (No. of automated test cases created in sprint / Total test cases created in sprint) × 100 | 85%+ of tests created within the same sprint as development [55] | |
| Throughput & Output | Weekly Strain Construction Throughput [19] | Total successful transformations per week | ~2,000 transformations/week (automated) [19] |
| Test Authoring Velocity [55] | Time from requirement finalization to executable automated test | 85-93% faster creation via autonomous generation [55] | |
| Resource Efficiency | Test Maintenance Burden Rate [55] | (Engineering hours spent on test maintenance / Total automation capacity) × 100 | Under 15% of automation capacity [55] |
| Test Execution Efficiency [55] | Average execution time and cost per test run | Cost per run < $5 for 1,000+ test suite [55] |
Table 2: Quality, Effectiveness, and Business Impact KPIs
| KPI Category | Specific KPI | Calculation Formula | Target Benchmark |
|---|---|---|---|
| Quality & Learning | Defect Detection Rate [54] [56] | (No. of defects found by automated tests / Total defects) × 100 | 90%+ of production defects detectable by tests [55] |
| First-Time Pass Rate [55] | (Test runs passing without investigation / Total test runs) × 100 | 95%+ first-time pass rate [55] | |
| Mean Time to Detect (MTTD) [55] | Average time from defect introduction to detection | 95%+ of defects detected within 24 hours of code commit [55] | |
| Coverage | Test Automation Coverage [54] | (No. of automated test cases / Total test cases) × 100 | Set based on strategic goals; 100% of revenue-critical processes [55] |
| Requirement Traceability Coverage [55] | (No. of requirements with linked tests / Total requirements) × 100 | 95%+ traceability for committed requirements [55] | |
| Business Impact | Test Automation ROI [54] [55] | [(Total benefits - Total cost) / Total cost] × 100 | 300%+ ROI (every $1 invested saves $3+) [55] |
| Production Incident Reduction Rate [55] | Year-over-year decrease in production incidents | 60%+ reduction in testing-preventable incidents [55] |
Experimental Protocols for KPI Implementation
Protocol 1: High-Throughput Strain Construction and Screening forBuildandTestKPIs
This protocol is adapted from automated workflows for engineering Saccharomyces cerevisiae and enables the tracking of throughput and efficiency KPIs [19].
Methodology:
- Platform Setup: Utilize an integrated robotic platform (e.g., Hamilton Microlab VANTAGE) with a central robotic arm, a pipetting deck, and integrated off-deck hardware including a plate sealer, plate peeler, and a 96-well thermocycler [19].
- Workflow Automation:
- Module 1: Transformation Setup and Heat Shock. The robot executes the lithium acetate/ssDNA/PEG method in a 96-well format. Key parameters like cell density, reagent volumes, and DNA concentration are optimized and programmed. The robotic arm transfers the sample plate to the thermal cycler for a hands-off heat shock step [19].
- Module 2: Washing. The system performs automated washing steps to remove transformation reagents.
- Module 3: Plating. The transformation mixture is plated onto solid media in omnitrays [19].
- KPI Tracking: The system logs the time taken for the entire process and the number of successful transformations, directly feeding into "Test Execution Time" and "Weekly Strain Construction Throughput" KPIs [19].
- Downstream Screening: Generated colonies are picked using an automated colony picker (e.g., QPix 460). High-throughput culturing in 96-deep-well plates is followed by chemical extraction and LC-MS analysis to measure product titer (e.g., verazine), informing the effectiveness of the
Testphase [19].
Protocol 2: Autonomous Enzyme Engineering forDesignandLearnKPIs
This protocol leverages AI and biofoundries for fully autonomous DBTL cycles, directly enabling learning efficiency KPIs [3].
Methodology:
- Initial
Design:- Input: A wild-type protein sequence and a quantifiable fitness function (e.g., enzymatic activity at neutral pH) [3].
- Process: A protein Large Language Model (LLM) (e.g., ESM-2) and an epistasis model (e.g., EVmutation) are combined to design a diverse initial library of ~180 protein variants, maximizing the quality of the starting point for the
Learnphase [3].
- Automated
BuildandTest:- Platform: An automated biological foundry (e.g., iBioFAB) executes a continuous workflow [3].
- Build: A high-fidelity DNA assembly method is used to construct variant libraries without intermediate sequencing, saving time and cost [3].
- Test: The platform performs automated protein expression, crude cell lysate preparation, and high-throughput enzyme activity assays [3].
- Machine Learning
LearnLoop:- Data Integration: Assay data from each cycle is used to train a low-data machine learning model (e.g., Gaussian process or random forest) to predict variant fitness [3] [9].
- Next-Cycle Design: The trained model proposes the next set of variants to build and test, balancing exploration and exploitation [3].
- KPI Tracking: This workflow directly measures the "Number of DBTL Cycles to Target" and "Variants Constructed per Target Improvement." As a proof of concept, this platform engineered a phytase variant with a 26-fold improvement in activity in just four rounds over four weeks [3].
Workflow Visualization
The following diagrams, generated with Graphviz DOT language, illustrate the logical relationships and data flows within an automated DBTL framework and its supporting screening protocol.
Diagram 1: Automated DBTL Cycle with KPI Monitoring. This diagram illustrates the closed-loop, AI-powered DBTL cycle, supported by an integrated robotic platform. The KPI dashboard monitors performance at every phase, facilitating continuous improvement.
Diagram 2: Automated Strain Screening Protocol.
This workflow details the high-throughput Build and Test phases for strain engineering, showing the path from genetic parts to quantifiable product titer data, with relevant KPIs tracked throughout the automated steps.
The Scientist's Toolkit: Essential Research Reagent Solutions
The successful implementation of the aforementioned protocols and the reliable tracking of KPIs depend on a foundation of robust reagents and automated systems.
Table 3: Key Research Reagent Solutions for Automated DBTL Workflows
| Item | Function in Automated Workflow |
|---|---|
| Hamilton Microlab VANTAGE | A core robotic liquid handling platform that can be integrated with off-deck hardware (e.g., thermocyclers, sealers) to enable end-to-end, hands-off workflow execution for strain or plasmid construction [19]. |
| iBioFAB (Illinois Biofoundry) | An advanced, fully automated biofoundry that integrates machine learning with robotics to conduct complete DBTL cycles for protein or pathway engineering without human intervention [3]. |
| High-Fidelity DNA Assembly Mix | Enzymatic mixes for highly accurate DNA assembly, crucial for automated Build steps to eliminate the need for intermediate sequence verification and maintain workflow continuity [3]. |
| Cell-Free Protein Synthesis (CFPS) System | A crude cell lysate system used for rapid in vitro testing of enzyme expression and pathway functionality, bypassing whole-cell constraints and accelerating the initial Test and Learn phases [10] [3]. |
| Nuclera eProtein Discovery System | A cartridge-based, automated benchtop system for parallel screening of protein expression and purification conditions, streamlining the Build and Test steps for protein engineering [57]. |
| Stable Cell Lines/Competent Cells | High-quality, reproducible microbial cells (e.g., E. coli, S. cerevisiae) prepared for high-throughput transformation, ensuring consistent success rates in automated strain construction [19]. |
The development of oral solid dosage (OSD) forms for drugs with poor water solubility remains a formidable challenge in pharmaceutical sciences [58]. The pharmaceutical pipeline is increasingly shifting toward low-solubility, low-permeability compounds, particularly in therapeutic areas like oncology and antivirals, creating an urgent need for practical, phase-appropriate, and scalable bioavailability enhancement strategies [58]. Lipid and surfactant based formulations represent a scientifically viable approach to improve bioavailability of poorly soluble compounds, with several successfully marketed products including Sandimmune and Sandimmune Neoral (cyclosporin A), Norvir (ritonavir), and Fortovase (saquinavir) utilizing self-emulsifying drug delivery systems (SEDDS) [59].
This application note examines the formulation development process for poorly soluble compounds within the context of automated robotic platforms implementing the Design-Build-Test-Learn (DBTL) cycle. Groundbreaking technologies developed over the past decades have enormously accelerated the construction of efficient systems, and integrating state-of-the-art tools into the DBTL cycle is shifting the metabolic engineering paradigm from artisanal labor toward fully automated workflows [60]. The integration of automation into pharmaceutical formulation represents a paradigm shift that can significantly accelerate the development of clinically viable formulations for poorly soluble drugs.
Background and Significance
The Biopharmaceutical Challenge
Formulation development begins with understanding the physicochemical properties of the active pharmaceutical ingredient (API), particularly LogP, pKa, solubility, and permeability [58]. These characteristics are typically categorized using the Biopharmaceutics Classification System (BCS) and Developability Classification System (DCS). BCS Class II drugs (poorly soluble but highly permeable) are frequently addressed using relatively straightforward strategies like surfactant addition, microenvironmental pH adjustments, salt selection, particle size reduction, or creation of solid dispersions [58]. BCS Class III and IV drugs, which possess poor permeability with or without poor solubility, require more sophisticated formulation strategies, often involving lipid-based delivery systems or permeation enhancers that facilitate absorption by mimicking endogenous lipid pathways [58].
Mechanisms of Absorption Enhancement
The bioavailability-enhancing properties of lipid and surfactant-based systems have been most often attributed to the ability of these vehicles to maintain the compound in solution throughout the gastrointestinal (GI) tract, thereby preserving maximal free drug concentration for absorption [59]. The release of compounds from SEDDS formulations occurs primarily through two pathways: interfacial transfer and vehicle degradation [59]. Interfacial transfer is a concentration gradient-driven process where the compound diffuses from the formulation into the bulk intestinal fluid or directly across the intestinal membrane, with the rate and extent governed by partition coefficient, solubility in donor and recipient phases, and particle size [59]. Vehicle degradation, particularly lipolysis catalyzed by pancreatic lipase, releases monoacylglycerols, diacylglycerols, and free fatty acids that further assist in solubilizing poorly soluble compounds in GI fluids [59].
Table 1: Clinically Marketed Lipid-Based Formulations for Poorly Soluble Drugs
| Drug Product | API | Company | Formulation Technology | Therapeutic Area |
|---|---|---|---|---|
| Sandimmune/Neoral | Cyclosporin A | Novartis | SEDDS/Microemulsion | Immunosuppression |
| Norvir | Ritonavir | Abbott | SEDDS | HIV |
| Fortovase | Saquinavir | Roche | SEDDS | HIV |
| Agenerase | Amprenavir | GlaxoSmithKline | SEDDS | HIV |
Emerging evidence suggests that certain formulation excipients play more than just inert roles in drug delivery. Excipients including Cremophor EL, Tween 80, Labrasol, and Miglyol polyethoxylated have demonstrated inhibitory effects on the P-glycoprotein (PGP) efflux transporter, potentially improving bioavailability of drug molecules that are PGP substrates [59]. Several excipients have also shown influence on lymphatic transport, another potential mechanism for enhancing systemic availability of lipophilic compounds [59].
Automated Formulation Development Platform
The Design-Build-Test-Learn Cycle for Formulation Optimization
The DBTL cycle represents a systematic framework for iterative optimization that can be dramatically accelerated through automation [60]. When applied to formulation development for poorly soluble compounds, each stage addresses specific challenges:
- Design Phase: In silico prediction of API-excipient compatibility, preformulation studies, and experimental design for high-throughput screening.
- Build Phase: Automated preparation of prototype formulations using liquid handling robots and high-throughput processing equipment.
- Test Phase: Parallelized characterization of critical quality attributes including dissolution profiling, solubility assessment, and solid-state characterization.
- Learn Phase: Data analysis and modeling to identify optimal formulation strategies and inform the next design cycle.
Fully autonomous implementation of the DBTL cycle heralds a transformative approach to constructing next-generation pharmaceutical formulations in a fast, high-throughput fashion [60]. Automated platforms enable the rapid evaluation of multiple formulation variables simultaneously, including different lipid systems, surfactant combinations, and drug loading levels, which would be prohibitively time-consuming using manual approaches.
Integrated Workflow for Lipid-Based Formulation Development
The following diagram illustrates the automated DBTL workflow for developing lipid-based formulations of poorly soluble compounds:
Automated DBTL Workflow for Formulation Development
This integrated workflow enables rapid iteration through formulation design space, with each cycle generating predictive models that enhance the efficiency of subsequent iterations. The continuous learning aspect is particularly valuable for understanding complex excipient-drug interactions that influence formulation performance.
Experimental Protocols and Methodologies
High-Throughput Solubility and Compatibility Screening
Objective: To rapidly identify optimal lipid and surfactant combinations for poorly soluble compounds using automated screening platforms.
Materials and Equipment:
- Liquid handling robot with temperature-controlled deck
- Multi-well plate spectrophotometer
- Automated titration system
- Library of pharmaceutically acceptable lipids, surfactants, and co-solvents
- Test compound (API)
Procedure:
- Prepare stock solutions of test compound in DMSO at 100 mM concentration.
- Using automated liquid handling, dispense varying ratios of lipid and surfactant combinations into 96-well plates.
- Add calculated volumes of stock solution to achieve target drug loading (typically 1-10% w/w).
- Subject plates to controlled heating-cooling cycles (40°C for 2 hours, followed by 25°C for 22 hours) with continuous shaking.
- Centrifuge plates at 3000 rpm for 15 minutes to separate undissolved compound.
- Quantify drug concentration in supernatant using UV spectrophotometry or HPLC-MS.
- Identify lead formulations exhibiting maximum saturation solubility and physical stability.
Data Analysis: Calculate solubility parameters and generate compatibility heat maps to guide formulation development.
Automated Preparation and Characterization of SEDDS Formulations
Objective: To prepare and characterize self-emulsifying drug delivery systems using automated platforms.
Materials and Equipment:
- Robotic liquid handling system
- In-line homogenizer
- Dynamic light scattering instrument for droplet size analysis
- Lipolysis assay kit
- Selected lipid-surfactant combinations from screening
Procedure:
- Based on solubility screening results, prepare SEDDS preconcentrates using automated liquid handling to combine oil, surfactant, co-surfactant, and drug in optimal ratios.
- Mix formulations using in-line homogenization at controlled temperature (37°C).
- Assess self-emulsification properties by diluting 1 mL of preconcentrate in 250 mL of simulated gastric and intestinal fluids with gentle agitation.
- Determine droplet size distribution and zeta potential using dynamic light scattering.
- Evaluate formulation stability under accelerated conditions (40°C/75% RH for 1 month).
- Conduct in vitro lipolysis studies to assess drug precipitation behavior during digestion.
Data Analysis: Correlate emulsion droplet size with in vitro performance; identify formulations maintaining drug solubility throughout digestion process.
In Vitro-In Vivo Correlation (IVIVC) Protocol
Objective: To establish correlation between in vitro dissolution data and in vivo pharmacokinetic parameters.
Materials and Equipment:
- USP apparatus with automated sampling
- LC-MS/MS system for bioanalysis
- Suitable animal model (typically beagle dogs or minipigs)
Procedure:
- Conduct dissolution testing of optimized formulations using USP apparatus with biorelevant media.
- Administer formulations to animal models according to approved protocols.
- Collect serial blood samples at predetermined time points.
- Analyze plasma samples using validated LC-MS/MS methods.
- Determine pharmacokinetic parameters including C~max~, T~max~, AUC, and t~1/2~.
- Establish IVIVC using convolution/deconvolution methods.
Data Analysis: Develop mathematical models relating in vitro dissolution profiles to in vivo absorption; use these models to predict clinical performance.
Key Research Reagent Solutions
The following table details essential materials and their functions in developing formulations for poorly soluble compounds:
Table 2: Essential Research Reagents for Lipid-Based Formulation Development
| Category | Specific Examples | Function | Application Notes |
|---|---|---|---|
| Lipids | Medium-chain triglycerides (Miglyol), Long-chain triglycerides (soybean oil), Mixed glycerides | Solubilize drug, promote lymphatic transport, enhance permeability | Susceptible to enzymatic degradation; chain length affects digestion rate and drug release [59] |
| Surfactants | Labrasol, Labrafil, Gelucire, Cremophor EL, Tween 80 | Stabilize emulsion, enhance wetting, inhibit efflux transporters | May inhibit P-glycoprotein efflux transport; concentration affects emulsion stability and potential GI irritation [59] |
| Co-solvents | Ethanol, PEG, Propylene glycol | Enhance drug solubility in preconcentrate, adjust viscosity | Can affect self-emulsification performance; may precipitate upon aqueous dilution |
| Solid Carrier | Neusilin, Syloid, Aerosil | Adsorb liquid formulations for solid dosage form conversion | High surface area and porosity essential for maintaining dissolution performance |
| Lipolysis Inhibitors | Tetrahydrolipstatin, Orlistat | Control digestion rate of lipid formulations | Useful for modulating drug release profile; requires careful optimization |
Data Presentation and Analysis
Quantitative Comparison of Formulation Technologies
Table 3: Comparative Analysis of Formulation Strategies for Poorly Soluble Drugs
| Formulation Approach | Typical Bioavailability Improvement | Development Complexity | Scalability | Clinical Success Examples |
|---|---|---|---|---|
| Lipid Solutions | 1.5-3x | Low | High | Atovaquone oil suspension [59] |
| SEDDS/SMEDDS | 2-5x | Medium | Medium | Cyclosporine (Neoral), Ritonavir (Norvir) [59] |
| Solid Dispersions | 2-10x | High | Medium-High | Numerous recent approvals |
| Particle Size Reduction | 1.5-2x | Low | High | Fenofibrate reformulation [58] |
| Complexation | 2-4x | Medium | High | Various cyclodextrin-based products |
| Lipid Nanoparticles | 3-8x | High | Low-Medium | Emerging technology |
Clinical Performance Data
Table 4: Clinical Pharmacokinetic Data for Selected Lipid-Based Formulations
| Drug Compound | Formulation Type | Study Design | Key Findings | Reference |
|---|---|---|---|---|
| Cyclosporine | Sandimmune (original) | 12 fasted healthy volunteers, four-way crossover | Lower AUC and C~max~ compared to microemulsion | Drewe et al. 1992 [59] |
| Cyclosporine | Neoral (microemulsion) | 24 fasted healthy volunteers, three-way crossover | Higher and more consistent bioavailability; reduced food effect | Kovarik et al. 1994 [59] |
| Atovaquone | Oil suspension (Miglyol) | Randomized three-way crossover (n=9) | AUC: Oil suspension ~ aqueous suspension > tablets | Rolan et al. 1994 [59] |
| Clomethiazole | Lipid mixture (arachis oil) | Cross-over study (n=10) | Plasma concentrations: Aqueous suspension > lipid mixture > tablets | Fischler et al. 1973 [59] |
The data demonstrate that lipid-based formulations, particularly SEDDS and microemulsions, can significantly enhance the bioavailability of poorly soluble compounds while reducing inter- and intra-subject variability [59]. The clinical performance advantage stems from the ability of these formulations to maintain drug solubility throughout the gastrointestinal transit and potentially enhance permeability through excipient-mediated effects on efflux transporters and metabolic enzymes.
Integration with Automated Robotic Platforms
The development of clinically viable formulations for poorly soluble compounds can be dramatically accelerated through integration with automated robotic platforms implementing the DBTL cycle. Automated biofoundries enable high-throughput screening of excipient combinations, rapid prototyping of formulations, and parallelized characterization of critical quality attributes [60]. Machine learning algorithms applied to the rich datasets generated by these platforms can identify non-intuitive excipient combinations and optimize formulation compositions with minimal manual intervention.
The following diagram illustrates the information flow and decision points in an automated formulation development platform:
Automated Formulation Development Information Flow
This automated approach enables comprehensive exploration of the formulation design space while generating structured datasets that fuel machine learning algorithms. The continuous learning aspect allows the platform to become increasingly efficient at identifying optimal formulation strategies for specific compound classes, ultimately reducing development timelines and improving clinical success rates.
The development of clinically viable formulations for poorly soluble compounds requires a systematic approach that integrates fundamental understanding of biopharmaceutical principles with advanced formulation technologies. Lipid-based delivery systems, particularly SEDDS and SMEDDS, have demonstrated significant clinical success in enhancing the bioavailability of poorly soluble drugs while reducing variability and food effects [59]. The integration of these formulation strategies with automated robotic platforms implementing the DBTL cycle represents a transformative approach that can dramatically accelerate the development process while improving formulation robustness [60].
As the pharmaceutical pipeline continues to shift toward more challenging molecules with increasingly poor solubility characteristics, the implementation of automated, high-throughput formulation development platforms will become increasingly essential for delivering safe, effective, and patient-friendly products to the market [58]. These advanced approaches enable more comprehensive exploration of formulation design space, generation of predictive models, and ultimately, more efficient development of clinically viable formulations for poorly soluble compounds.
The integration of robotic platforms and artificial intelligence (AI) software suites is revolutionizing experimental science, particularly within the framework of automated Design-Build-Test-Learn (DBTL) cycles. These technologies enable researchers to move from low-throughput, sequential experimentation to high-throughput, parallelized processes that rapidly generate data for AI-driven analysis and optimization. In life sciences and drug development, this approach is critical for overcoming the complexity and cost associated with traditional methods, such as combinatorial pathway optimization in metabolic engineering [9]. Automated DBTL cycles facilitate the systematic exploration of vast design spaces—for instance, by testing numerous genetic constructs or process parameters—while machine learning models extract meaningful patterns from the resulting high-dimensional data to recommend subsequent experiments. This comparative analysis provides a structured evaluation of current robotic and AI technologies, detailed protocols for their implementation, and practical resources to guide researchers in selecting and deploying these powerful tools.
Comparative Analysis of Robotic and AI Platforms
AI and Automation Software Suites
AI automation platforms are software solutions that connect applications, automate repetitive tasks, and incorporate AI to enhance decision-making within workflows. They are particularly valuable for managing data flow between different digital tools and automating analysis in a DBTL pipeline.
Table 1: Comparison of Leading AI Automation Platforms
| Platform Name | Primary Use Case | AI Capabilities | Integration Ecosystem | Pricing Model |
|---|---|---|---|---|
| Latenode [61] | Cost-efficient, complex workflow automation | AI-driven workflows, JavaScript support, AI Code Copilot | 1,000+ pre-built connectors, REST/GraphQL APIs, custom connectors | Execution-time pricing; Free tier available, paid plans from $19/month |
| Zapier [61] | Simple, app-to-app task automation | AI features for text generation and data extraction | Thousands of app integrations, including major SaaS platforms | Task-based pricing; Free tier available, paid plans scale with task volume |
| Make (formerly Integromat) [61] | Complex, multi-step data transformation | Integrations with OpenAI, Google AI for text analysis, image recognition | Native integrations with Salesforce, HubSpot, Shopify; custom HTTP modules | Operations-based pricing; Free tier (1,000 ops/month), paid from $9/month |
| UiPath [61] | Enterprise-scale Robotic Process Automation (RPA) | AI Center for document understanding, computer vision, machine learning | Pre-built connectors for SAP, Salesforce, Office 365; handles legacy systems | Subscription-based; Community/Free tier, Pro from ~$420/month, Enterprise custom |
| Lindy [62] | Automating workflows with custom AI agents | Customizable AI agents for emails, lead generation, CRM logging | 2,500+ integrations via Pipedream; Slack, Gmail, HubSpot, Salesforce | Credit-based; Free plan (400 credits), Pro at $49.99/month (5,000 credits) |
Robotic Platforms and AI Robotics Suites
Robotic platforms encompass the hardware and software required to perform physical tasks in laboratory and industrial settings. When integrated with AI, these systems can perform complex, adaptive operations.
Table 2: Comparison of Leading AI Robotics Platforms
| Platform Name | Primary Use Case | Key Features | AI Integration | Best For |
|---|---|---|---|---|
| NVIDIA Isaac Sim [63] | Photorealistic simulation for robot training | GPU-accelerated, physics-based simulation, ROS/ROS2 support | Synthetic data generation for AI model training | Developers creating autonomous machines; simulation-heavy workflows |
| ROS 2 (Robot Operating System) [63] | Open-source robotics middleware | Real-time communication, vast open-source library & community | Requires third-party AI model integration | Research labs, startups, and academic projects |
| Boston Dynamics AI Suite [63] | Enterprise-ready mobile robotics | Pre-trained navigation/manipulation models, fleet management | Optimized AI for proprietary hardware (Spot, Atlas) | Industrial applications with advanced mobility needs |
| ABB Robotics IRB [63] | Industrial assembly, welding, packaging | AI-powered motion control, digital twin, predictive maintenance | AI for optimizing industrial robot movements | Large-scale manufacturing and industrial automation |
| Universal Robots UR+ [63] | Collaborative robots (cobots) for SMEs | Drag-and-drop programming, marketplace of pre-built apps | Plug-and-play AI applications for inspection, pick-and-place | Small to medium-sized businesses (SMEs) seeking easy adoption |
| MazorX (Medtronic) [64] | Robotic-assisted spinal surgery | High-precision screw placement guidance, real-time navigation | Proprietary AI for surgical planning and execution | Medical institutions performing complex spinal instrumentation |
Specialized AI Tools for Research and Development
Beyond integrated platforms, specialized AI tools address specific tasks within the research workflow, such as code development, data analysis, and content generation.
- Coding Assistants: Tools like GitHub Copilot and Cursor provide real-time code suggestions and natural language editing, drastically reducing development time for custom automation scripts and data analysis pipelines [65].
- AI Research Assistants: Perplexity excels at providing real-time, fact-checked research answers with source citations, accelerating the initial "Learn" phase of the DBTL cycle [62].
- Data Analysis Platforms: Obviously AI allows researchers to run no-code predictions on business and experimental data, facilitating data-driven decision-making [62].
Application Notes: Experimental Protocols for Automated DBTL
Protocol 1: Automated Combinatorial Pathway Optimization in Metabolic Engineering
This protocol outlines a simulated DBTL cycle for optimizing a metabolic pathway to maximize product yield, a common challenge in synthetic biology and drug development [9].
1. Design Phase
- Objective Definition: Define the optimization goal (e.g., maximize the flux toward a target compound, G).
- Parameter Selection: Identify pathway genes/enzymes (A, B, C, etc.) for combinatorial manipulation.
- Library Design: Create an in silico library of strain designs by assigning different expression levels (e.g., 5 discrete levels) to each selected enzyme. This simulates the use of a DNA library with different promoters/RBSs.
2. Build Phase (In Silico)
- Model Configuration: Use a mechanistic kinetic model (e.g., built with the SKiMpy package) representing the metabolic pathway integrated into a host organism (e.g., E. coli) [9].
- Strain Simulation: For each design in the library, simulate the effect of changed enzyme levels by modifying the corresponding
Vmaxparameters in the kinetic model. - Data Generation: Run simulations (e.g., of a batch bioreactor process) to calculate the resulting product flux (titer/yield/rate) for each strain design.
3. Test Phase (In Silico)
- Performance Analysis: Rank all simulated strain designs based on the target metric (product flux of G).
- Data Collection: Compile a dataset where the input variables are the enzyme expression levels and the output/target variable is the product flux.
4. Learn Phase
- Machine Learning Training: Train a supervised machine learning model (e.g., Gradient Boosting or Random Forest, which are robust in low-data regimes) on the collected dataset [9].
- Model Validation: Validate the model's predictive performance using hold-out test data or cross-validation.
- Design Recommendation: Use the trained model to predict the performance of a new, much larger set of hypothetical strain designs. Select the top N (e.g., 50) designs with the highest predicted flux for the next DBTL cycle.
5. Iteration
- Repeat steps 2-4, using the recommended designs as the new library for the subsequent "Build" phase. The model iteratively learns the complex, non-intuitive relationships between enzyme levels and product yield, guiding the search toward the global optimum.
Protocol 2: Evaluating Robotic Platform Performance in a Surgical Workflow
This protocol provides a methodology for comparing the technical performance of different robotic platforms in a controlled setting, using spine surgery as a model system [64].
1. Experimental Setup
- Platform Selection: Select robotic platforms for evaluation (e.g., Mazor X, TiRobot, Renaissance).
- Control Definition: Define control groups (conventional freehand technique and/or non-robotic navigation).
- Outcome Measures: Define primary (e.g., screw placement accuracy, breach incidence) and secondary (e.g., neurologic complication rate, blood loss) metrics [64].
2. Data Collection
- Literature Review & Meta-Analysis: Conduct a systematic literature search in databases (e.g., MEDLINE, EMBASE) for clinical studies comparing the selected platforms against controls.
- Data Extraction: From included studies, extract sample sizes, mean outcome values, standard deviations, and odds ratios for the defined metrics.
3. Data Analysis
- Network Meta-Analysis: Employ standard pairwise and network meta-analysis techniques with a random effects model (REM) to compare the performance of all platforms simultaneously, even if they were not directly compared in the source literature [64].
- Statistical Significance: Set a significance level (e.g., P < 0.05). Calculate odds ratios (OR) for categorical outcomes (e.g., breaches) and mean differences (MD) for continuous outcomes (e.g., blood loss).
4. Interpretation
- Ranking Platforms: Rank the robotic platforms based on their statistical performance across the analyzed metrics (e.g., TiRobot and Renaissance demonstrated the best overall accuracy in spine surgery) [64].
- Bias Assessment: Evaluate potential conflicts of interest and source bias in the underlying studies (e.g., 60% of TiRobot and 30% of SpineAssist studies showed potential bias).
The Scientist's Toolkit: Essential Research Reagent Solutions
This section details key software and platform "reagents" essential for implementing the automated DBTL workflows and protocols described in this analysis.
Table 3: Key Research Reagent Solutions for Automated DBTL Research
| Item Name | Function/Application | Specifications/Details |
|---|---|---|
| SKiMpy (Symbolic Kinetic Models in Python) [9] | A Python package for building, simulating, and analyzing kinetic models of metabolic networks. | Used for in silico "Build" and "Test" phases; allows perturbation of enzyme concentrations (Vmax) to simulate genetic changes. |
| Gradient Boosting / Random Forest Models [9] | Machine learning algorithms for the "Learn" phase, predicting strain performance from combinatorial data. | Ideal for the low-data regime common in early DBTL cycles; robust to experimental noise and training set biases. |
| NVIDIA Isaac Sim [63] | A simulation platform for creating digital twins of robotic systems and generating synthetic training data. | Provides photorealistic, physics-based simulation to train and validate robotic platforms before physical deployment. |
| Robot Operating System 2 (ROS 2) [63] | Open-source robotics middleware providing a standardized communication layer for sensors, actuators, and control software. | Enables integration of diverse hardware components and AI modules; foundation for building custom robotic research platforms. |
| Execution-Time Credit (Latenode) [61] | The unit of consumption for running automated workflows on cloud-based automation platforms. | Crucial for budgeting and planning cloud-based automation; more cost-effective for AI-intensive workflows than per-task pricing. |
Workflow Visualization
Automated DBTL Cycle for Metabolic Engineering
The following diagram illustrates the iterative, closed-loop workflow of a simulated Design-Build-Test-Learn cycle for combinatorial pathway optimization.
Robotic Platform Evaluation Methodology
This diagram outlines the systematic process for conducting a meta-analysis to evaluate and compare the performance of different robotic platforms.
Within the automated Design-Build-Test-Learn (DBTL) research framework, robotic platforms are indispensable for achieving high-throughput experimentation. The justification for their substantial capital investment requires rigorous economic evaluation. Cost-minimization analysis (CMA) serves as a critical tool for this purpose, enabling researchers and financial decision-makers to identify the most economically efficient pathway when comparing robotic systems or experimental strategies that demonstrate equivalent experimental outcomes [66]. This Application Note provides a structured framework for conducting a CMA, focusing on the acquisition, maintenance, and operational expenditures associated with robotic platforms for automated DBTL cycles in biopharmaceutical research.
Theoretical Foundations of Cost-Minimization Analysis
Cost-minimization analysis (CMA) is a form of economic evaluation used to identify the least costly alternative among interventions that have been empirically demonstrated to produce equivalent health—or in this context, experimental—outcomes [66]. Its application is only appropriate after therapeutic or functional equivalence has been reliably established. In the realm of robotics, this could mean comparing two platforms that yield statistically indistinguishable results in terms of throughput, data quality, or success rates in a specific DBTL protocol, such as protein expression optimization [66].
It is crucial to distinguish CMA from other economic evaluation methods. Unlike cost-effectiveness analysis (which compares costs to a single natural outcome unit) or cost-benefit analysis (which values all consequences in monetary terms), CMA focuses exclusively on costs once outcome equivalence is confirmed [67] [66]. This makes it the most straightforward economic evaluation when the primary question is financial efficiency between comparable options.
Structuring the Cost Analysis for Robotic Platforms
A comprehensive CMA must account for all relevant costs over the system's expected lifespan. The evaluation should be conducted from a specific perspective, such as that of the research organization, which incurs the direct financial impacts [67]. The following table catalogs the primary cost categories for a robotic DBTL platform.
Table 1: Cost Categories for Robotic DBTL Platform Analysis
| Cost Category | Description | Typical Measurement Unit |
|---|---|---|
| Acquisition (Capital Expenditure) | ||
| Hardware & Robotics | Core robotic arms, liquid handlers, plate readers, incubators. | One-time cost (USD) |
| System Integration & Installation | Costs for integrating components into a functional workflow. | One-time cost (USD) |
| Initial Software License | Fees for operating software, control systems, and data management. | One-time cost (USD) |
| Maintenance (Recurring) | ||
| Service Contracts & Preventive Maintenance | Annual contracts for technical support, calibration, and parts. | Annual cost (USD/year) |
| Software Subscription & Updates | Recurring fees for ongoing software support and upgrades. | Annual cost (USD/year) |
| Replacement Parts & Consumables | Non-experimental wear-and-tear parts (e.g., belts, tips). | Annual cost (USD/year) |
| Operational Expenditures (Recurring) | ||
| Research Consumables | Experiment-specific reagents, plates, tips, buffers. | Per experiment or batch (USD/run) |
| Labor & Personnel | Time spent by scientists and technicians to operate the platform. | Full-Time Equivalent (FTE) or hours/week |
| Facility & Utilities | Dedicated lab space, electricity, climate control. | Annual cost (USD/year) |
| Data Management & Storage | Computational resources for processing and storing large datasets. | Annual cost (USD/year) |
The Time Frame and Discounting
The time frame for the analysis should be long enough to capture all relevant costs, typically spanning the platform's useful operational lifespan (e.g., 5-7 years) [67]. For analyses exceeding one year, future costs must be discounted to their present value to account for time preference, using a standard discount rate (e.g., 3-5%) to enable a fair comparison [67].
Experimental Protocol: Conducting a CMA for a DBTL Robotic Platform
This protocol outlines the steps for performing a cost-minimization analysis to compare two automated robotic platforms for optimizing protein expression in E. coli.
The objective is to determine the less costly of two robotic platforms, Platform A and Platform B, which have been previously shown to produce equivalent results in optimizing inducer concentration and feed release for GFP expression in an E. coli system over a 5-year time horizon [68].
Materials and Reagents
Table 2: Key Research Reagent Solutions for the DBTL Experiment
| Item | Function in the Experiment |
|---|---|
| E. coli / Bacillus subtilis Strain | Model microbial host for the genetic system and GFP production. |
| Expression Vector | Plasmid containing the gene for Green Fluorescent Protein (GFP). |
| Chemical Inducers (e.g., IPTG) | Triggers expression of the target GFP gene within the bacterial system. |
| Growth Media & Feeds | Provides essential nutrients for microbial growth and protein production. |
| Microplates & Labware | Standardized containers for high-throughput culturing and assays. |
| Robotic Platform | Automated system for liquid handling, incubation, and measurement. |
Step-by-Step Methodology
Define the Objective and Scope: Clearly state the goal: to identify the lower-cost platform for a specific, equivalent DBTL workflow. Define the perspective (organizational) and time horizon (5 years).
Establish Outcome Equivalence: Confirm that the platforms being compared (A and B) produce equivalent results in the target application. This is a prerequisite for CMA [66]. For this protocol, we assume that both platforms achieve equivalent optimization of GFP expression in the E. coli system, as measured by fluorescence intensity and time-to-target, based on prior validation studies [68].
Identify and Categorize Costs: Using Table 1 as a guide, itemize all costs for Platform A and Platform B. Collaborate with vendors, finance, and lab operations to gather accurate data.
Measure and Value Costs:
- Acquisition Costs: Obtain quotes from vendors for the complete system.
- Maintenance Costs: Obtain annual service contract and software subscription fees.
- Operational Costs:
- Consumables: Calculate the cost of reagents and labware for a single DBTL cycle, then multiply by the annual number of cycles.
- Labor: Estimate the FTE requirement for platform operation and multiply by the fully-loaded salary cost.
- Utilities/Storage: Use institutional cost rates.
Model Costs Over Time: Create a 5-year cost model for each platform. Apply the selected discount rate (e.g., 4%) to all future costs to calculate their present value. The following diagram illustrates the logical workflow and cost accumulation over the DBTL cycle.
Calculate and Compare Total Costs: Sum the discounted costs for each platform over the 5-year period to obtain the Total Present Value of Costs.
Perform Sensitivity Analysis: Test the robustness of the conclusion by varying key assumptions (e.g., discount rate, maintenance costs, number of annual experiments) to see if the recommendation changes.
Report Findings: Clearly present the total costs for each platform and state the least costly alternative, ensuring all assumptions are documented.
Case Study Example: DBTL Platform Selection
The following table presents a hypothetical cost comparison for two robotic platforms over a 5-year period, using a 4% discount rate. All costs are in thousands of USD (Present Value).
Table 3: Hypothetical 5-Year Cost-Minimization Analysis of Two Robotic Platforms
| Cost Category | Platform A (kUSD) | Platform B (kUSD) | Notes |
|---|---|---|---|
| Acquisition (Year 0) | |||
| Hardware & Integration | $950 | $1,200 | Platform B is a more integrated system. |
| Initial Software | $150 | $250 | |
| Subtotal | $1,100 | $1,450 | |
| Maintenance (Years 1-5) | |||
| Service Contracts | $400 | $300 | Platform B has a lower annual service fee. |
| Software Subscriptions | $100 | $150 | |
| Subtotal | $500 | $450 | |
| Operational (Years 1-5) | |||
| Research Consumables | $800 | $750 | Platform B has slightly higher efficiency. |
| Labor (1.0 FTE vs 0.7 FTE) | $500 | $350 | Platform B requires less manual intervention. |
| Data Management | $50 | $50 | Assumed equal. |
| Subtotal | $1,350 | $1,150 | |
| Total Present Value (5-Year) | $2,950 | $3,050 | Platform A is less costly. |
Interpretation: Despite a higher initial acquisition cost, Platform A's lower total cost over 5 years makes it the more economically efficient choice in this scenario, assuming equivalent experimental outcomes. This result is highly sensitive to the labor cost differential.
Cost-minimization analysis provides a structured and defensible method for optimizing financial resources in automated DBTL research. By systematically accounting for acquisition, maintenance, and operational expenditures over a defined time horizon, research organizations can make informed investments in robotic platforms, ensuring that capital is allocated to the most efficient technology, thereby maximizing the return on research investment.
The integration of Artificial Intelligence (AI) into drug discovery represents a paradigm shift, moving from traditional, resource-intensive processes to accelerated, data-driven approaches. AI is projected to generate between $350 billion and $410 billion annually for the pharmaceutical sector by 2025 [69]. A core driver of this transformation is the application of generative AI and machine learning (ML) to design novel therapeutic molecules and predict their behavior [70]. However, the journey from an in silico prediction to a clinically validated therapy is complex, requiring rigorous validation across preclinical and clinical stages to confirm translational potential. This process is increasingly being integrated into automated robotic platforms that execute the Design-Build-Test-Learn (DBTL) cycle, enhancing reproducibility, throughput, and data integrity [71] [72]. This Application Note provides detailed protocols and frameworks for validating AI-designed therapies, ensuring they are ready for clinical translation.
Validation Framework and Performance Metrics
A robust validation framework is essential for assessing the efficacy, safety, and pharmacokinetic (PK) properties of AI-designed therapies. The following metrics and models are critical for establishing translational potential.
Table 1: Key Performance Metrics for AI-Designed Therapies in Preclinical Validation
| Validation Area | Specific Metric | AI/Model Contribution | Benchmark/Target |
|---|---|---|---|
| Efficacy & Binding | Target Affinity (IC50, Kd) | AI-predicted binding scores & molecular interaction analysis [70] | nM to pM range |
| In vitro Potency | High-throughput screening on automated platforms [71] | >50% inhibition at 1μM | |
| Pharmacokinetics (PK) | Clearance (CL) | ML models predicting PK profile from chemical structure [73] | Consistent with desired dosing regimen |
| Volume of Distribution (Vd) | PBPK and compartmental models enhanced with ML [73] | Adequate tissue penetration | |
| Half-life (t₁/₂) | Comparative studies between ML and traditional PBPK models [73] | Suitable for clinical application | |
| Toxicology & Safety | In vitro Toxicity (e.g., hERG inhibition) | AI models for early toxicity and efficacy prediction [74] | IC50 > 10μM |
| In vivo Adverse Event Prediction | Interpretable ML models (e.g., SHAP analysis) for risk prediction [73] | Prediction of clinical adverse events (e.g., edema) | |
| Translational Biomarkers | Biomarker Identification | AI analysis of metabolomics data to identify biomarkers of target engagement [73] | Correlation with disease pathway and therapeutic response [75] |
The quantitative data from these validation stages must be systematically analyzed. AI-designed molecules have demonstrated the potential to reduce the time for drug design from 4-7 years to just 3 years [74], and AI-enabled workflows can save up to 40% of time and 30% of costs in bringing a new molecule to the preclinical candidate stage [69]. Furthermore, by 2025, it is estimated that 30% of new drugs will be discovered using AI, marking a significant shift in the drug discovery process [69].
Diagram 1: The Preclinical Validation Workflow for AI-designed Therapies.
Detailed Experimental Protocols
Protocol 1:In VitroEfficacy and Binding Assay on a Robotic Platform
This protocol outlines the steps for automated, high-throughput testing of AI-designed molecules for target binding and functional inhibition.
I. Objectives
- To determine the half-maximal inhibitory concentration (IC50) of AI-designed compounds against a purified target protein.
- To validate AI-predicted binding affinities using an automated biochemical assay.
II. Materials and Reagents
- AI-Designed Compounds: 10mM stock solutions in DMSO.
- Purified Target Protein: Recombinantly expressed, with a known activity assay.
- Assay Kit: Commercially available fluorescence- or luminescence-based activity kit.
- Labware: 384-well microplates, low-dead volume reservoirs.
- Automated Platform: Robotic system (e.g., RoboCulture, Opentrons OT-2) equipped with a liquid handler, plate reader, and orbital shaker [71].
III. Step-by-Step Procedure
- Plate Layout Definition: Program the robotic liquid handler to define the assay plate layout, including test compounds (8-point, 1:3 serial dilution), positive control (reference inhibitor), and negative control (DMSO only), with n=4 replicates per condition.
- Compound Dilution and Transfer:
- The robot performs serial dilutions of compounds in assay buffer in a separate dilution plate.
- Using the liquid handler, transfer 5μL of each diluted compound to the corresponding wells of the assay plate.
- Reaction Mixture Addition:
- Prepare a master mix containing the target protein and substrate in assay buffer.
- The robot dispenses 20μL of the master mix into all wells of the assay plate, initiating the reaction.
- Incubation and Kinetics: The robotic platform moves the assay plate to an integrated orbital shaker for mixing (30 seconds, 500 rpm) and then to a temperature-controlled incubator (e.g., 30°C) for 60 minutes.
- Signal Detection: The plate is transferred to an integrated microplate reader to measure fluorescence/luminescence.
- Data Analysis: The robotic platform's software automatically exports the raw data to a connected computer. Curve fitting and IC50 calculation are performed using data analysis software (e.g., PRISM) via a 4-parameter logistic (4PL) model.
IV. Troubleshooting
- High Background Signal: Ensure reagents are at room temperature before use and check for substrate contamination.
- Poor Z'-factor: Confirm pipetting accuracy of the robot using a dye-based test and check protein activity.
Protocol 2: AI-Augmented Pharmacokinetic Prediction
This protocol uses machine learning models to predict key PK parameters from chemical structure, supplementing or guiding early in vivo studies.
I. Objectives
- To predict human clearance and volume of distribution for AI-designed molecules using a validated ML framework [73].
- To prioritize compounds with a high probability of success for further testing.
II. Materials and Software
- Chemical Structures: SMILES strings of the AI-designed compounds.
- Software: Access to an ML prediction platform (e.g., proprietary or open-source tools like those described in the literature [73]).
- Computing Environment: Standard workstation or cloud computing instance.
III. Step-by-Step Procedure
- Data Input: Compile a list of SMILES strings for all candidate molecules into a .csv file.
- Descriptor Calculation: The ML platform automatically calculates molecular descriptors and fingerprints for each compound.
- Model Execution: Run the pre-trained ML model (e.g., gradient boosting, random forest) for PK parameter prediction. The model should have been trained on large datasets of known chemical structures and their corresponding PK parameters [73] [71].
- Result Interpretation: The model outputs predictions for human CL, Vd, and t₁/₂. Compounds falling within the acceptable target ranges (see Table 1) are prioritized.
- Validation: For top candidates, validate predictions using in vitro hepatocyte clearance and plasma protein binding assays, feeding the results back to improve the AI model in a DBTL cycle.
IV. Troubleshooting
- Out-of-Distribution Warning: If the model flags a compound as structurally dissimilar to its training set, interpret predictions with caution and rely more heavily on experimental data.
Protocol 3: Biomarker Identification and Analysis Using AI
This protocol leverages AI to discover and validate translational biomarkers from complex biological data, which can be used for patient stratification in clinical trials [75].
I. Objectives
- To identify plasma or tissue-based biomarkers associated with target engagement or disease pathophysiology using AI-driven analysis of metabolomics data [73] [69].
II. Materials and Reagents
- Patient Samples: Plasma or serum from preclinical models or early clinical studies.
- Metabolomics Platform: LC-MS or NMR instrumentation.
- Data Analysis Software: Python/R environment with libraries for ML (e.g., scikit-learn, XGBoost) and statistical analysis.
III. Step-by-Step Procedure
- Sample Preparation and Metabolomics Profiling: Process samples using a standardized, automated protocol for metabolite extraction and run on the LC-MS platform to obtain raw spectral data.
- Data Preprocessing: Use computational tools for peak alignment, normalization, and metabolite identification. Create a data matrix of metabolite abundances across samples.
- AI-Driven Biomarker Discovery:
- Apply unsupervised learning (e.g., PCA) to visualize natural clustering and outliers.
- Use supervised ML models (e.g., XGBoost [70]) to identify metabolites that best distinguish disease from control groups, or responders from non-responders.
- Employ SHAP (SHapley Additive exPlanations) analysis to interpret the model and identify the most impactful metabolites [70].
- Biomarker Validation: Validate the identified biomarkers in an independent, larger cohort of samples using targeted assays.
Diagram 2: AI-Driven Biomarker Discovery Workflow.
Integration with Automated Robotic Platforms
The validation protocols described are ideally suited for integration into automated robotic "Self-Driving Labs" (SDLs). Platforms like RoboCulture demonstrate how a general-purpose robotic manipulator can perform key biological tasks—liquid handling, equipment interaction, and real-time monitoring via computer vision—over long durations without human intervention [71]. This automation is critical for ensuring the reproducibility and scalability of validation experiments.
- Reproducibility and Traceability: Robotic systems eliminate experimenter bias and ensure mechanical repeatability [72]. Furthermore, frameworks like the semantic execution tracing framework log all sensor data and robot actions with semantic annotations, creating a comprehensive, auditable digital trail of the entire experiment [72]. This addresses the "reproducibility crisis" and builds trust in the generated data.
- Closed-Loop Experimentation: These platforms can be integrated with the AI design engine to form a closed-loop system. The robot executes the "Build" and "Test" phases of the DBTL cycle, generating high-quality data that is then fed back to the AI for the "Learn" phase, which then informs the next "Design" cycle. This creates a continuous, accelerated pipeline for optimizing therapeutic candidates.
The Scientist's Toolkit: Essential Research Reagent Solutions
Table 2: Key Reagents and Materials for Validating AI-Designed Therapies
| Item/Category | Function in Validation | Example Specifications |
|---|---|---|
| AI-Designed Compound Libraries | The core therapeutic candidates to be tested for efficacy, PK, and safety. | Purity >95% (HPLC), 10mM stock solution in DMSO [70]. |
| Target-Specific Assay Kits | To measure functional activity and binding affinity of the target protein in a high-throughput format. | Validated Z'>0.5, luminescence or fluorescence-based readout. |
| PBPK/ML Simulation Software | To predict human pharmacokinetics and dose-exposure relationships prior to clinical trials. | Integration with ML-based PK prediction models [73] [74]. |
| Multi-Sensor Robotic Platform | To automate liquid handling, assay execution, and real-time monitoring of cell cultures or reactions. | 7-axis manipulator, force feedback, RGB-D camera, modular behavior trees [71]. |
| Digital Twin Simulation Framework | To create computational replicas of patients or trial cohorts for optimizing clinical trial design and analysis. | Integrated with semantic digital twins for execution tracing [72] [76]. |
Regulatory and Translational Considerations
Navigating the regulatory landscape is a critical final step in translation. Regulatory agencies are developing specific frameworks for AI in drug development.
- FDA (U.S.): Employs a flexible, case-specific model, encouraging early dialogue through its various review and advice pathways. The FDA has received over 500 submissions incorporating AI components [76].
- EMA (Europe): Has a more structured, risk-tiered approach outlined in its 2024 Reflection Paper. It mandates strict requirements for "high patient risk" or "high regulatory impact" applications, including frozen AI models in pivotal trials and comprehensive traceability documentation [76].
For a successful regulatory submission, a prospective, multi-stage validation plan for any AI/ML component is essential. This plan must address data quality, model robustness, and ongoing performance monitoring, especially for models that continue to learn post-market approval [76]. Ensuring that AI-designed therapies are validated within these evolving regulatory frameworks is paramount for their successful transition from the lab to the clinic.
Conclusion
The automation of the Design-Build-Test-Learn cycle through robotic platforms and AI represents a paradigm shift with the potential to fundamentally break the decades-long stagnation in pharmaceutical R&D productivity. The synthesis of insights from all four intents confirms that this integration is not merely an incremental improvement but a necessary evolution to create more efficient, predictive, and successful discovery pipelines. The foundational drive is clear, the methodologies are increasingly accessible, and the optimization strategies are proven to deliver tangible efficiencies and cost savings. As validation through real-world case studies and comparative economic analyses grows, the future direction points toward even more tightly integrated, autonomous laboratories. The implications for biomedical and clinical research are profound, promising to accelerate the delivery of safer, more effective, and patient-centered drug products to those in need. The journey ahead requires continued investment, cross-disciplinary collaboration, and a commitment to data-driven science, ultimately positioning automated DBTL cycles as the cornerstone of next-generation biomedical discovery.
References
- 1. Biopharma RD Faces Productivity And Attrition Challenges ... [https://www.clinicalleader.com/doc/biopharma-r-d-faces-productivity-and-attrition-challenges-in-2025-0001]
- 2. Respite from rising trial costs is a distant dream in 2025 [https://www.clinicaltrialsarena.com/analyst-comment/respite-rising-trial-costs-distant-dream-2025/]
- 3. A generalized platform for artificial intelligence-powered ... [https://www.nature.com/articles/s41467-025-61209-y]
- 4. Emerging New Drug Modalities in 2025 [https://www.bcg.com/publications/2025/emerging-new-drug-modalities]
- 5. establishing an autonomous test-learn cycle to optimize ... [https://pubmed.ncbi.nlm.nih.gov/39911814]
- 6. New Drug Delivery Systems Market Size 2025-2029 [https://www.technavio.com/report/new-drug-delivery-systems-market-industry-analysis]
- 7. DRUG DELIVERY TRENDS FOR 2025 [https://ondrugdelivery.com/drug-delivery-trends-for-2025/]
- 8. DBTL Approach in Synthetic Biology [https://www.moleculardevices.com/applications/synthetic-biology/dbtl-approach]
- 9. Simulated Design–Build–Test–Learn Cycles for Consistent ... [https://pmc.ncbi.nlm.nih.gov/articles/PMC10510747/]
- 10. The knowledge driven DBTL cycle provides mechanistic ... [https://microbialcellfactories.biomedcentral.com/articles/10.1186/s12934-025-02729-6]
- 11. From frozen cell bank to product assay: high-throughput strain... [https://microbialcellfactories.biomedcentral.com/articles/10.1186/s12934-023-02140-z]
- 12. DBTL bioengineering cycle for part characterization and ... [https://www.sciencedirect.com/science/article/abs/pii/S2405896324017488]
- 13. Machine Learning on a Robotic for the Platform of... Design [https://pmc.ncbi.nlm.nih.gov/articles/PMC9339531/]
- 14. The Data-Driven Revolution: What the Lab of the Future ... [https://www.autonomous.ai/ourblog/the-data-driven-revolution-what-the-lab-of-the-future-looks-like]
- 15. Automating the design-build-test-learn cycle towards next- ... [https://www.sciencedirect.com/science/article/pii/S187167842300002X]
- 16. An automated Design-Build-Test-Learn pipeline for ... [https://www.nature.com/articles/s42003-018-0076-9]
- 17. Lab of the Future Conference 2025: How the Digital ... [https://www.thermofisher.com/blog/connectedlab/lab-of-the-future-conference-2025-how-the-digital-automated-lab-ai-and-orchestration-are-accelerating-science/]
- 18. Automated standardization and harmonization of ... [https://www.sciencedirect.com/science/article/pii/S138650562500348X]
- 19. Automated strain construction for biosynthetic pathway ... [https://pmc.ncbi.nlm.nih.gov/articles/PMC12611344/]
- 20. Abstraction hierarchy to define biofoundry workflows and ... [https://www.nature.com/articles/s41467-025-61263-6]
- 21. Technologies for design-build-test-learn automation and ... [https://link.springer.com/article/10.1007/s13721-024-00455-4]
- 22. Leading AI-Driven Drug Discovery Platforms [https://www.sciencedirect.com/science/article/abs/pii/S0031699725075118]
- 23. Unlocking the future of drug discovery through advances in AI [https://www.astrazeneca.com/content/astraz/what-science-can-do/topics/data-science-ai/unlocking-future-drug-discovery-through-AI-advances.html]
- 24. a new generative machine-learning formulation for molecules [https://pubs.rsc.org/en/content/articlehtml/2025/fd/d4fd00113c]
- 25. Generative design of compounds with desired potency from ... [https://jcheminf.biomedcentral.com/articles/10.1186/s13321-024-00852-x]
- 26. A generative framework for enhancing drug target ... [https://www.nature.com/articles/s41598-025-01589-9]
- 27. Rise of the Robochemist [https://arxiv.org/html/2510.10337v1]
- 28. Artificial intelligence-driven autonomous laboratory for ... [https://www.oaepublish.com/articles/cs.2025.66]
- 29. Robotics in Drug Discovery Market Trends and Growth ... [https://finance.yahoo.com/news/robotics-drug-discovery-market-trends-150000460.html]
- 30. How pharmaceutical robots are being used in 2025 [https://standardbots.com/blog/pharmaceutical-robots]
- 31. Closing the loop: establishing an autonomous test-learn ... [https://www.frontiersin.org/journals/bioengineering-and-biotechnology/articles/10.3389/fbioe.2024.1528224/full]
- 32. How AI Is Transforming Clinical Trials | AHA [https://www.aha.org/aha-center-health-innovation-market-scan/2025-10-21-how-ai-transforming-clinical-trials]
- 33. Transformative Role of Artificial Intelligence in Drug ... [https://pmc.ncbi.nlm.nih.gov/articles/PMC12406033/]
- 34. The Autonomous Lab: AI Platforms Redefining Enzyme ... [https://www.ailurus.bio/post/the-autonomous-lab-ai-platforms-redefining-enzyme-engineering]
- 35. Advantages and disadvantages of robot automation in 2025 [https://standardbots.com/blog/pros-and-cons-of-robot-automation]
- 36. The 7 Biggest AI Adoption Challenges for 2025 [https://www.stack-ai.com/blog/the-biggest-ai-adoption-challenges]
- 37. Robotic automation companies face multiple challenges in ... [https://usa.inquirer.net/182428/robotic-automation]
- 38. Top Challenges Manufacturers Face with Robotics - Mujin [https://mujin-corp.com/blog/top-robotics-challenges-manufacturers-face/]
- 39. Breaking the Bottleneck in AI-Driven Protein Engineering [https://www.ailurus.bio/post/breaking-the-bottleneck-in-ai-driven-protein-engineering]
- 40. How AI in Predictive Maintenance 2025 Saves Costs [https://kanerika.com/blogs/ai-in-predictive-maintenance/]
- 41. Predictive Maintenance Trends & Features 2025 [https://www.uptimeai.com/resources/predictive-maintenance-trends-2025/]
- 42. 8 Trends Shaping the Future of Predictive Maintenance [https://worktrek.com/blog/predictive-maintenance-trends/]
- 43. AI-Powered IT Asset Management & Predictive Maintenance [https://www.lansweeper.com/blog/itam/transform-it-strategy-with-ai-powered-asset-management-and-predictive-maintenance/]
- 44. Ensuring Data Integrity in Automated Sample Management ... [https://xavo.com/news-downloads/ensuring-data-integrity-in-automated-sample-management-systems]
- 45. Google SRE - Data Integrity: Principles and Best Practices [https://sre.google/sre-book/data-integrity/]
- 46. Essential Data Integrity Best Practices for 2025 [https://atlan.com/data-integrity-best-practices/]
- 47. High-Throughput Data Analysis for qPCR [https://www.neb.com/en-us/tools-and-resources/feature-articles/development-of-a-high-throughput-data-analysis-method-for-quantitative-real-time-pcr?srsltid=AfmBOopWAkxIFwtwhAksI-YbMn8OZVrSsaHhyFsXNkMPG_-FFZxKIinU]
- 48. Cross-Disciplinary Training Centers [https://biomedsci.ucsd.edu/training-areas/cross-disciplinary-training-centers.html]
- 49. How to Train a Biomedical Data Scientist [https://medicine.yale.edu/news-article/how-to-train-a-biomedical-data-scientist/]
- 50. Galvanizing Data Science Applications in Early Stage Drug ... [https://datasciences.utoronto.ca/crosstalk-bootcamp/]
- 51. How to Calculate Test Automation ROI [https://www.browserstack.com/guide/calculate-test-automation-roi]
- 52. Test Automation ROI - How to Calculate It? [https://www.globalapptesting.com/blog/test-automation-roi]
- 53. A Practical Guide to Calculating ROI in Test Automation [https://www.headspin.io/blog/a-deep-dive-into-calculating-test-automation-roi]
- 54. Test Automation KPIs [https://testrigor.com/blog/test-automation-kpis/]
- 55. 15 Test Automation KPIs That You Should Track [https://www.virtuosoqa.com/post/test-automation-kpis]
- 56. How to Identify KPIs for Your Test Automation Strategy [https://www.testdevlab.com/blog/how-to-identify-kpis-for-your-test-automation-strategy]
- 57. Inside ELRIG's Drug Discovery 2025 [https://www.drugtargetreview.com/article/190237/inside-elrigs-drug-discovery-2025/]
- 58. Formulating OSDs for Poorly Soluble Drugs [https://www.tabletscapsules.com/3641-Technical-Articles/619822-Formulating-OSDs-for-Poorly-Soluble-Drugs/]
- 59. Clinical studies with oral lipid based formulations of poorly ... [https://pmc.ncbi.nlm.nih.gov/articles/PMC2374933/]
- 60. Automating the design-build-test-learn cycle towards next- ... [https://pubmed.ncbi.nlm.nih.gov/36736693/]
- 61. Best AI Automation Platforms 2025: Complete Software ... [https://latenode.com/blog/best-ai-automation-platforms-2025-complete-software-comparison]
- 62. The 18 Best AI Platforms in 2025 – Tested & Reviewed [https://www.lindy.ai/blog/ai-platforms]
- 63. Top 10 AI Robotics Platforms Tools in 2025 [https://www.devopsschool.com/blog/top-10-ai-robotics-platforms-tools-in-2025-features-pros-cons-comparison/]
- 64. A comparison of key performance metrics of major robotic ... [https://link.springer.com/article/10.1007/s00586-025-08990-y]
- 65. Top 10 AI tools for software developers in 2025 - Graphite [https://graphite.com/guides/top-10-ai-tools-software-developers]
- 66. Cost-Minimization Analysis - an overview [https://www.sciencedirect.com/topics/nursing-and-health-professions/cost-minimization-analysis]
- 67. Chapter 5 eHealth Economic Evaluation Framework - NCBI [https://www.ncbi.nlm.nih.gov/books/NBK481593/]
- 68. Closing the loop: establishing an autonomous test-learn cycle to optimize induction of bacterial systems using a robotic platform - PubMed [https://pubmed.ncbi.nlm.nih.gov/39911814/]
- 69. AI in Pharma and Biotech: Market Trends 2025 and Beyond [https://www.coherentsolutions.com/insights/artificial-intelligence-in-pharmaceuticals-and-biotechnology-current-trends-and-innovations]
- 70. Generative AI for drug discovery and protein design [https://www.sciencedirect.com/science/article/pii/S2590098625000107]
- 71. RoboCulture: A Robotics Platform for Automated Biological ... [https://arxiv.org/html/2505.14941v1]
- 72. Open, Reproducible and Trustworthy Robot-Based ... [https://arxiv.org/html/2508.11406v1]
- 73. Artificial Intelligence in Clinical and Translational Science [https://pmc.ncbi.nlm.nih.gov/articles/PMC12580936/]
- 74. Opportunities and challenges in using AI in drug discovery ... [https://www.dlapiper.com/en/insights/publications/2025/09/from-molecule-to-market-opportunities-and-challenges-in-using-ai-in-drug-discovery-and-development]
- 75. AI and the future of biomarker analysis in early R&D [https://www.drugtargetreview.com/article/190428/ai-and-the-future-of-biomarker-analysis-in-early-rd/]
- 76. The future of AI regulation in drug development: a comparative ... [https://pmc.ncbi.nlm.nih.gov/articles/PMC12598624/]